Figures & data
Figure 1 Experimental procedures and behavioral protocol. Aβ oligomers were microinjected into the CA1 region of the mouse hippocampus, after 7 days the mice were chronically treated with 7.8-Dihydroxyflavone (DHF, 5 mg/kg, i.g.), or vehicle every day. A multisensory fusion training (MSFT) protocol was also carried out, involving treadmill exercises at two different speeds (10 m/min and 15 m/min for 10 min, 3 times per day, 6 days per week), and 40 Hz acousto-optic stimulation (1 hour per day, 6 days per week). Day 29 began behavioral tests, including. Following the Conclusion of behavioral assessments, samples were collected from euthanized mice for further studies (Sac).
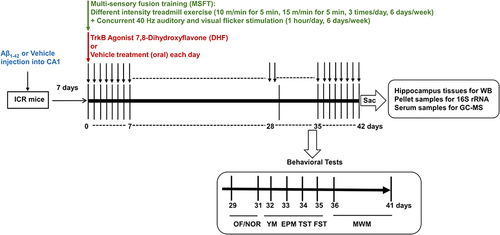
Figure 2 Improvement in learning and working memory in Aβ-induced mice by combining DHF and MSFT interventions. (A) Experimental schedule for the NOR and YM programs. (B and C) Number of line crossings and rear behaviors during the OF test on the first day. (D) Duration of exploration of two identical items during the NOR test on the following day. (E) Exploration time for two distinct items measured during the NOR test on the third day. (F) Time spent by each group of mice in the target arm during the YM test. (G) The number of entries from each group of mice in the target arm during the YM test. *P < 0.05, **P < 0.01, ***P < 0.001.
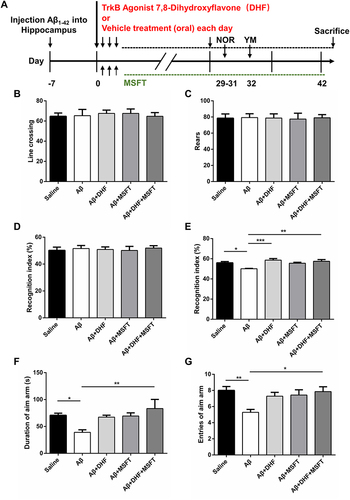
Figure 3 Improvement in cognitive impairment of spatial learning and memory in Aβ-induced mice after administering DHF and MSFT intervention. (A) Experimental schedule for the MWM program. (B) Trajectory of the MWM test for each group on the fifth day. (C) Time taken by the mice in each group to find the target platform during the training phase. (D) Swim velocity during the training phase. (E) Time spent finding the platform at the end of the training phase. (F) Traveling distance in the target quadrant during exploration. (G) Number of mice crossing the platform in the target quadrant. *P < 0.05, **P < 0.01.
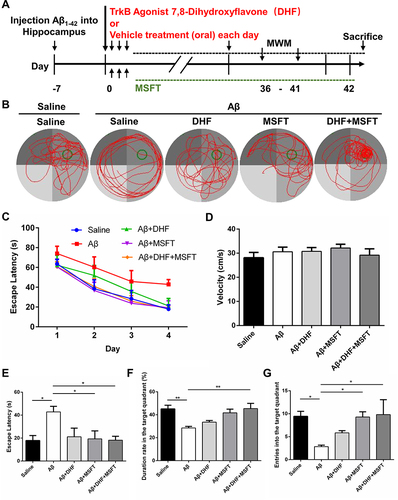
Figure 4 Amelioration of anxiety and depression-like behavior in Aβ-induced mice by combining DHF and MSFT intervention. (A) Experimental schedule. (B) Percentage of time spent by each group of mice in the open arms during the EPM. (C) Percentage of entries into the open arms during the EPM. Immobility time in the TST (D) and FST (E). *P < 0.05, **P < 0.01.
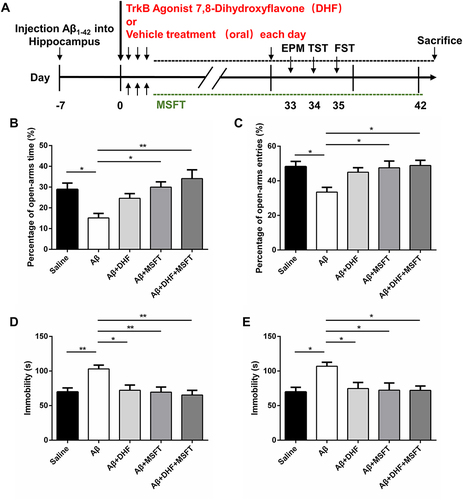
Figure 5 Increase in BDNF, PSD95, VGF, and p-CREB protein levels in the hippocampus of Aβ-induced mice due to the combined application of DHF and MSFT intervention. (A) Western blot expression images of the respective proteins in mouse hippocampal tissue. (B–J) Expression levels of BDNF (28 kDa), VGF, PSD-95, Nrf2, p-Ser9-GSK3β, total GSK3α/β, p-CREB and CREB protein in the mouse hippocampal tissue. *P < 0.05, **P < 0.01.
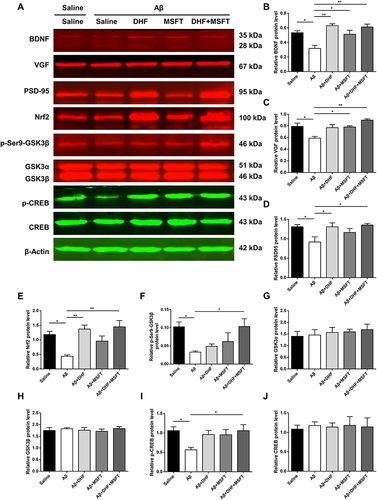
Figure 6 Differences in microbiota among mice belonging to different groups according to the 16S rRNA data. (all groups: n=6) (A and B) Comparison of the distribution of microbiota at the phylum and genus levels across various groups. (C) Clustering chart of species abundance at the genus level. (D and E) Distribution histogram of LDA score and cladogram among different groups.
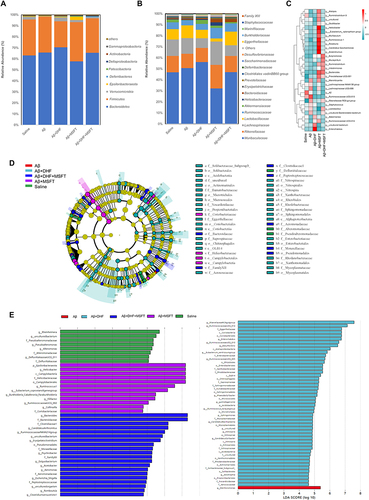
Figure 7 Distribution histogram of LDA score and cladogram. (A and C) The hierarchical tree diagram depicting the multi-level species hierarchy. (B and D) The LDA discriminant result plot of the differentially enriched gut microbiota between Aβ+DHF+MSFT Group and Aβ+DHF group or Aβ+MSFT group, with an LDA score >3.
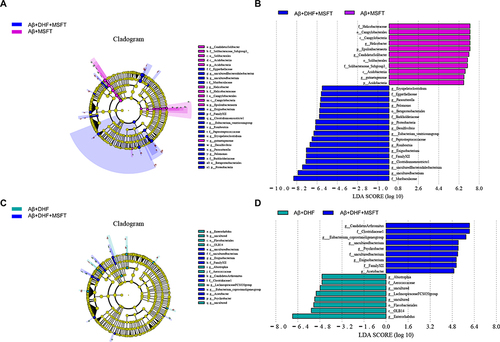
Figure 8 DHF and MSFT intervention altered serum metabolite expression profiles in mice. (A) PCA is employed to assess the metabolite of Aβ group and Aβ + DHF + MSFT group (all groups: n=4). (B) An MA map illustrates the metabolites that were differentially expressed in Aβ + DHF + MSFT mice compared with that in mice induced by Aβ oligomers. (C–E) A heat map depicting the hierarchical expression profile of different metabolites. (F) Between DHF and MSFT interventions, differentially expressed metabolites are identified using GO analysis.
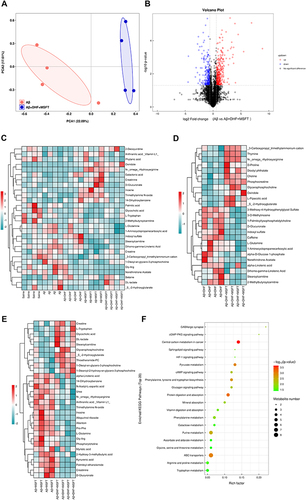
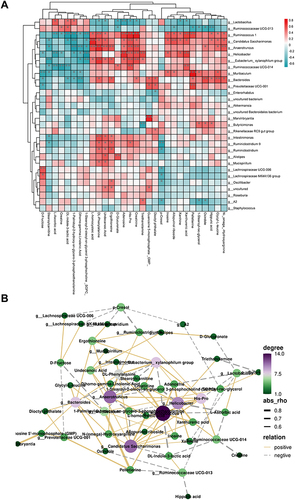
Figure 9 Analysis of Spearman correlation between microbiota and metabolites. (A) Clustering heatmap of microbiome and metabolites at the genus level. The heatmap displays a total of 166 significantly correlated differential genera and metabolites, with 54 pairs exhibiting a more significant correlation with P < 0.01. (B) Network diagram depicting the correlation between microbiome and metabolites in each group. The network displays the correlation between 30 metabolites and 30 bacterial genera. *P < 0.05, **P < 0.01 and ***P < 0.001.