
Figures & data
Table 1 Overview of High-Z-Based NPs Synthesized by Radiolysis and Their Applications
Figure 1 HR-TEM images of PtPEG NPs synthesized in water with an initial PtII concentration of 10−2 mol.L−1 and a PEG:Pt molar ratio of ca. 100, measured at different magnifications. Scale bars: (A) 0.5 μm, (B) 50 nm and (C) 10 nm. Size distribution of PtPEG NPs determined by (D) HR-TEM and (E) DLS. (F) Scheme of PtPEG NPs in aqueous solution.
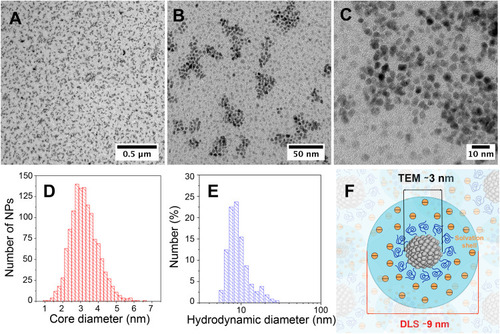
Figure 2 XPS spectra of PtPEG NPs in the ranges of (A) Pt-4f, (B) C-1s, (C) O-1s and (D) N-1s core levels.
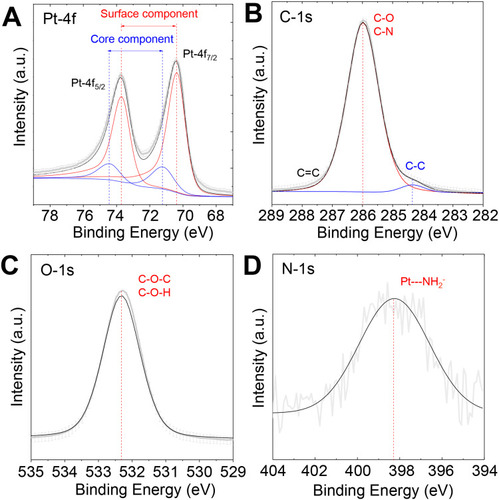
Figure 3 FT-IR spectra of (A) pure PEG-OH, (B) pure PtII precursor, (C) PtII precursor mixed with PEG-OH before irradiation and (D) PtPEG NPs obtained after irradiation of the PtII precursor mixed with PEG-OH.
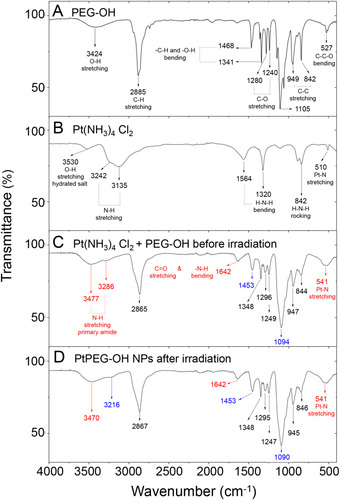
Figure 4 (A) Schematic representation of the Nano-SIMS principle. Nano-SIMS images of a HeLa cell loaded with PtPEG NPs. Panels correspond to the intracellular location of (B) P− and (C) 194Pt−. (D) Merged image of 194Pt− and P−. The arrow points out the location of NPs in the cell cytoplasm.
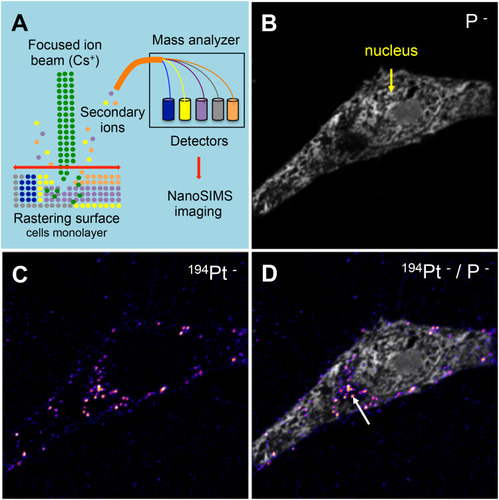
Figure 5 (A) Surviving fractions of HeLa cells irradiated by γ-rays (●, ●) and carbon ions (■, ■) in controls and in the presence of PtPEG NPs as a function of the radiation dose. (B) Amplification factors as a function of the radiation doses for γ-rays (red columns) and carbon ions (blue columns).
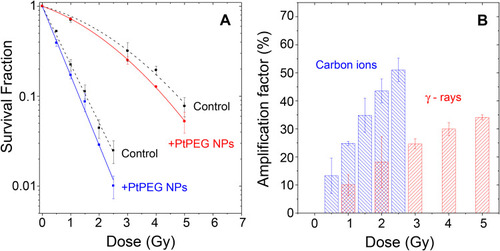
Figure 6 Nanosized damage induced by γ-rays in the bio-nanoprobes free from NPs (■) and in the presence of PtPEG NPs (■), as a function of the irradiationdose. Results obtained in the presence of DMSO in samples free from NPs (□) or with PtPEG NPs (□).
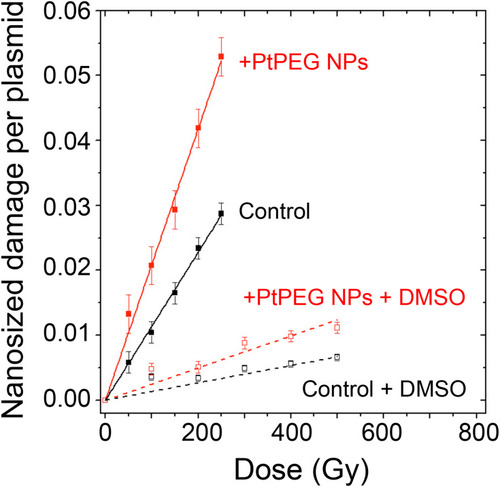
Table 2 Yields of Controls and Plasmids Loaded with PtPEG NPs with an NP:Plasmid Ratio Close 4:1. DMSO Was Added in Some Experiments. The mAF is Also Reported