Figures & data
Figure 1 Subject wearing the sleep profiler.
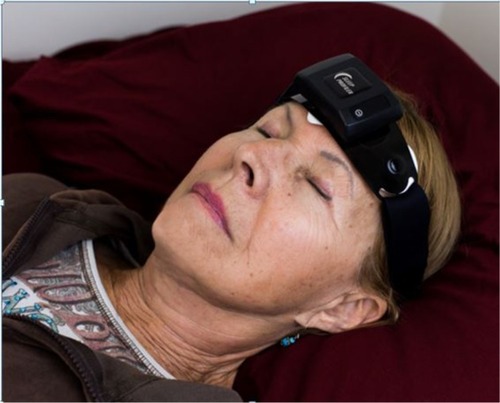
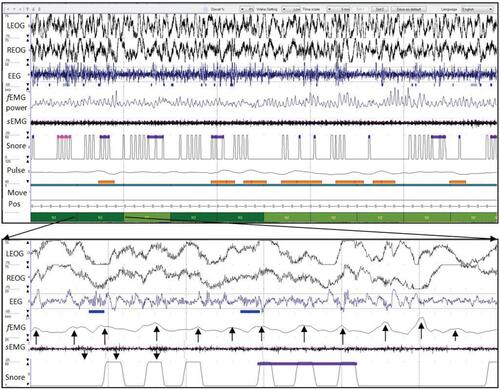
Figure 2 Thirty seconds epoch during REM sleep with differential recordings from AF7-Fpz, AF8-Fpz, and AF7-AF8 (labeled LEOG, REOG, and EEG, respectively), fEMG power, differential EMG, head movement, and head position.
Notes: The first arrow highlights the 4.5 seconds misalignment that coincided with a movement ~2.5 hour into the study. The second arrow identifies a muscle twitch (eg, facial muscle contraction), based in its appearance in the frontopolar signals but not the submental EMG signals.
Abbreviations: EMG, electromyography; fEMG, frontalis electromyography; REM, rapid eye movement.
Abbreviations: EMG, electromyography; fEMG, frontalis electromyography; REM, rapid eye movement.
Table 1 Descriptive statistics
Table 2 Distributions of mean CC results stratified by strength of agreement when 1 second and 15 minutes averaged sEMG and fEMG power was compared
Table 3 Distributions of power (µVCitation2) and CV across all records by stage
short-legendFigure 2