
Figures & data
Figure 1 (Continue).
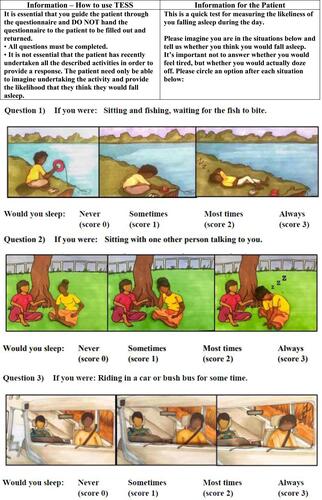
Figure 1 Top End Sleepiness Scale.
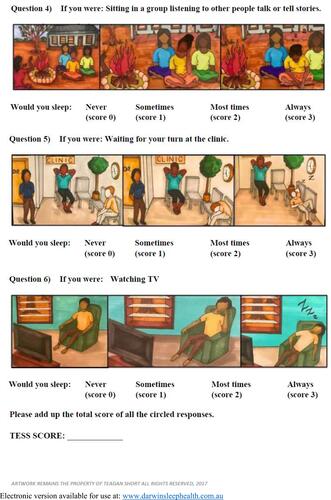
Table 1 Demographic and Clinical Parameters of the Study Participants
Table 2 Median and Mean Top End Sleepiness Scale Scores by Demographic Breakdown
Figure 2 Frequency plot of Top End Sleepiness Scale scores.
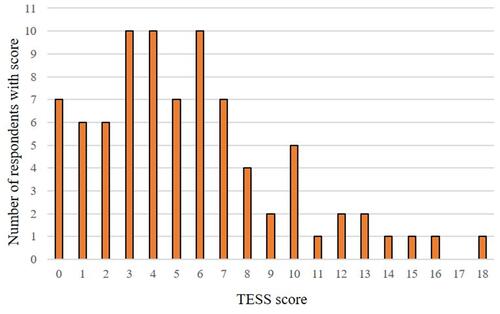
Table 3 Breakdown of Scores for Individual Top End Sleepiness Scale Questions with Cronbach’s α and Split Half Reliability Value
Table 4 Spearman Correlation Coefficient Between Questions Within Top End Sleepiness Scale and Top End Sleepiness Scale Total Score
Figure 3 Scatterplots showing the relationship between TESS (left) and ESS (right) scores and total AHI.
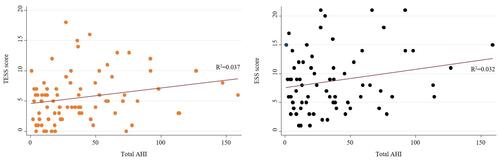
Figure 4 Area under the curve (AUC) receiver operator characteristic (ROC) for TESS and ESS tools sensitivity and 1-specificity overall (A) and for cut-offs TESS ≥3, TESS ≥8 and ESS ≥8 (B).
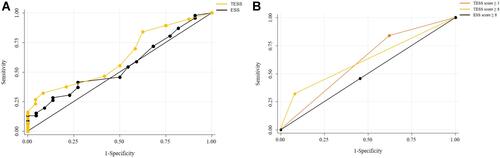
Table 5 Sensitivity, Specificity, Positive and Negative Predictive Values of Top End Sleepiness Scale in the Prediction of Obstructive Sleep Apnea (AHI ≥15), Severity, and by Sex Stratification
Table 6 Sensitivity, Specificity, Positive and Negative Predictive Values of Top End Sleepiness Scale in the Prediction of Moderate to Severe Obstructive Sleep Apnea for Scores ≥3 and ≥8 Compared to Other Alternative Obstructive Sleep Apnea Specific Screening Questionnaires