Figures & data
Table 1 Demographic and Sleep Characteristics
Table 2 A Comparison Between ST and DT Gait and Cognition
Figure 1 (A) Comparisons between the insomnia and no-insomnia groups in single-task (ST) and dual-task (DT) gait speed performance. (B) Comparisons between the insomnia and no-insomnia groups in single-task (ST) and dual-task (DT) cognitive (number of correct responses) performance. (C) Dual-task cost (DTC), for gait speed and number of correct responses in the cognitive subtraction task. *p<0.05, **p<0.01, ***p<0.001. Error bars show standard error.
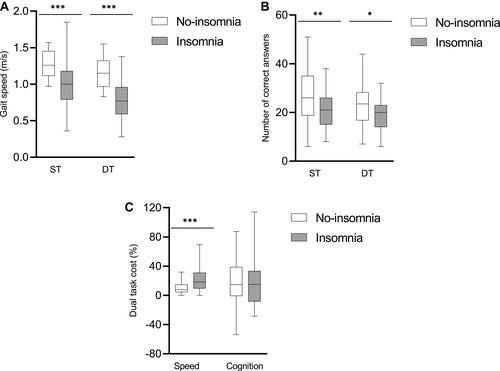
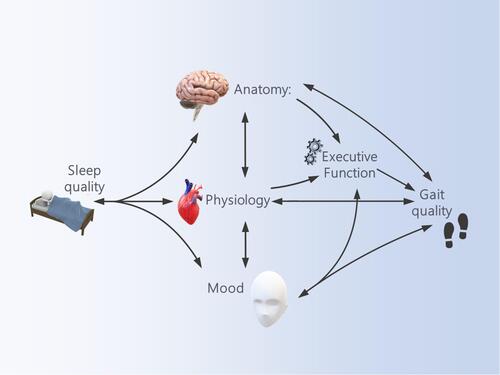
Figure 2 A theoretical model proposing underlying potential mechanisms explaining the link between sleep quality, executive function, and gait quality.