Figures & data
Table 1 Characteristics of the OSA Patients in 3 Severity Sub-Groups
Figure 1 Distribution of 25 parameters among 3 clinical subgroups.
Notes: Each panel consists of a stratified Kernel density plot, visualizing the distribution of a numeric variable within 3 OSA severity subgroups (Mild in green, Moderate in orange and Severe in red).
Abbreviations: Sys_BP, systolic blood pressure; Dia_BP, diastolic blood pressure; BMI, body mass index; HDL, high density lipid; LDL, low density lipid; FEV1, forced expiratory volume in one second; FVC, forced vital capacity; FENO, fractional exhaled nitric oxide; J’AWNO, bronchial nitric oxide flow; CANO, alveolar concentration of nitric oxide; ppb, part per billion; ESS, Epworth sleepiness scale; VAS, visual analog scale; HDL, high density lipid; LDL, low density lipid; SpO2, pulse oxygen saturation.
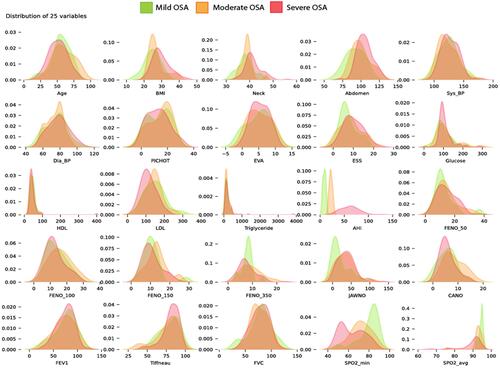
Table 2 Sleepiness Score and Polygraphy Metrics Among 3 OSA Severity Sub-Groups
Figure 2 Correlation network of 25 parameters.
Notes: In this correlation network, each node (in orange) indicates a clinical or functional parameter, the node size is proportional to number of significant correlations between that parameter to others.
Abbreviations: Sys_BP, systolic blood pressure; Dia_BP, diastolic blood pressure; BMI, body mass index; HDL, high density lipid; LDL, low density lipid; FEV1, forced expiratory volume inone second; FVC, forced vital capacity; FENO, fractional exhaled nitric oxide; J’AWNO, bronchial nitric oxide flow; CANO, alveolar concentration of nitric oxide; ppb, part per billion; ESS, Epworth sleepiness scale; VAS, visual analog scale; HDL, high density lipid; LDL, low density lipid; SpO2, pulse oxygen saturation.
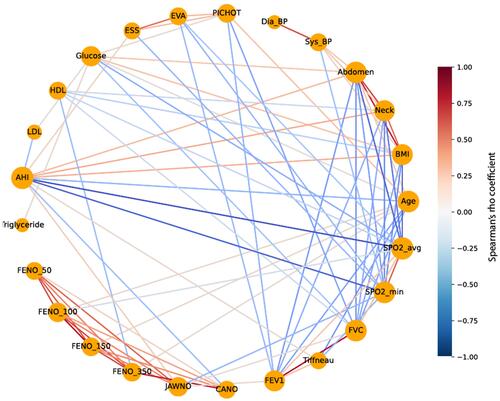
Table 3 Distribution of Exhaled NO Metrics Within 3 OSA Severity Sub-Groups
Table 4 Results of Pair-Wise Comparison for Exhaled NO Parameters
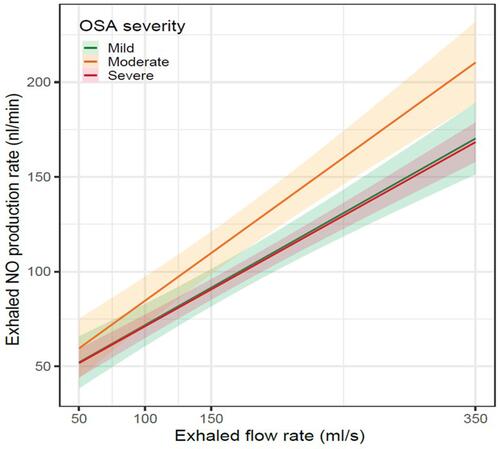
Figure 3 Impact of OSA severity on the result of multi-flow exhaled NO measurement.
Notes: This regression plot reproduces the SC Georges’s bi-compartment linear model: VNO = J’AWNO + CANO *VE, exploring the exhaled nitric oxide production rate (VNO, nl/min) to the sampling flow rate (VE). Based on this model, we determine the J’AWNO (bronchial nitric oxide flow) as the intercept of the regression line, and CANO (alveolar concentration of nitric oxide) as the regression slope. The graph illustrates how OSA (obstructive sleep apnea) severity (mild in green, moderate in orange, and severe red) modifies the J’AWNO and CANO values.