Figures & data
Figure 1 Protocol for PVT performance, physiological and subjective tests. During habitual bedtime, participants kept awake for 6 hours (shown in shadow). Participants completed a 10-min PVT (indicated by circles,
 ) every two hours. The physiological tests were conducted within each hour (indicated by asterisks,
 ).
).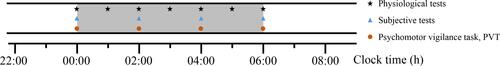
Figure 2 Psychomotor vigilance test (PVT) task.
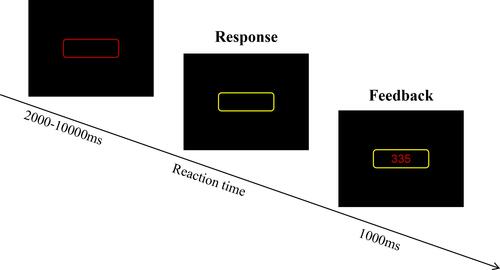
Table 1 Results of Absolute Values of Objective, Subjective, and Physiological Outcome Metrics Over the Course of Time (0:00, 2:00, 4:00, and 6:00 Am)
Figure 3 The time courses of the subjective, objective, and physiological outcome metrics from 0:00 to 6:00 am. (A) Number of lapses, (B) Mean 1/RT, (C) Sleepiness, (D) Fatigue, (E) Body temperature. Asterisks indicate significant differences, *p < 0.05. In each plot, the mean ± SEM is shown.
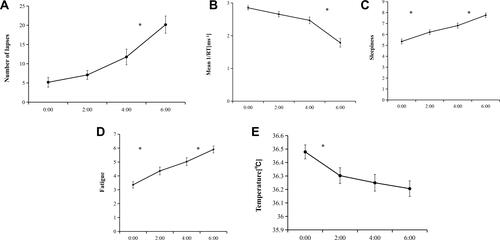
Table 2 Results of Relative Values of ∆objective, ∆subjective, and ∆physiological Outcome Metrics Over Time
Table 3 Correlation Analysis Results: Association of ∆temperature with ∆PVT and ∆subjective Outcome Metrics
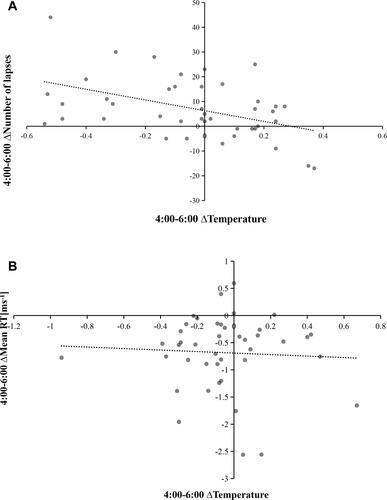
Figure 4 The correlations of the changes of subjective ratings/objective performance with the changes of body temperature during the period of prolonged wakefulness. (A) ∆Number of lapses between 4:00 and 6:00, (B) ∆Mean 1/RT between 4:00 and 6:00.