Figures & data
Table 1 Demographic Features and Baseline Screening Parameter Characteristics of the Three Different Samples
Figure 1 Illustration of the study procedures. The figure shows example visit schedules obtained from studies 1 and 2 (top row) and from study 3 (bottom row), after the three exposure conditions were randomly assigned to the nine EN. Randomization of exposure conditions was performed at the level of experimental night triplets (blocks) with the restriction that each exposure condition could occur only once per block. Participants went to bed at their habitual bedtimes on both the AN/SN and the EN [in the present examples, a lights-off time of 10:00 p.m. for an older individual (studies 1 and 2) and 11:00 p.m. for a younger study participant (study 3) was chosen] and slept for 7.5 h (studies 1 and 2) or 8 h (study 3), respectively. When scheduling the visits, it was further attempted to keep the day of the week as constant as possible for each individual.
![Figure 1 Illustration of the study procedures. The figure shows example visit schedules obtained from studies 1 and 2 (top row) and from study 3 (bottom row), after the three exposure conditions were randomly assigned to the nine EN. Randomization of exposure conditions was performed at the level of experimental night triplets (blocks) with the restriction that each exposure condition could occur only once per block. Participants went to bed at their habitual bedtimes on both the AN/SN and the EN [in the present examples, a lights-off time of 10:00 p.m. for an older individual (studies 1 and 2) and 11:00 p.m. for a younger study participant (study 3) was chosen] and slept for 7.5 h (studies 1 and 2) or 8 h (study 3), respectively. When scheduling the visits, it was further attempted to keep the day of the week as constant as possible for each individual.](/cms/asset/1648ea14-f1d5-4675-8110-0ed575e28521/dnss_a_12174238_f0001_c.jpg)
Table 2 Local Intensity Maxima of the Identified Clusters Within the Continuous Frequency Bands by Sleep Stage Separately for Sex and Age
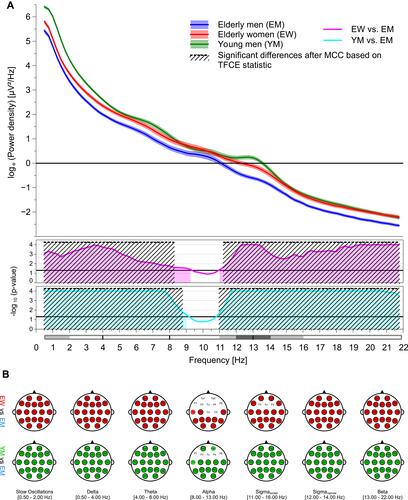
Figure 2 Age and sex effects on global (A) and regional (B) sleep EEG power recorded during NREM sleep. The top graph of (a) displays all-night log-transformed power spectral densities averaged across all 19 electrodes for elderly women, elderly men, and young men. The middle and bottom graphs of (A) show transformed p-values resulting from the comparisons of global sleep EEG power between elderly women and men, and from the comparisons of global sleep EEG power between young and elderly men, respectively. Black lines represent the transformed significance threshold of p = 0.05. Shaded areas under the curve indicate statistical significance of the original, uncorrected test statistic. The areas marked with diagonal lines highlight the differences that remained statistically significant after multiple comparison correction (MCC), based on the threshold-free cluster enhanced (TFCE) statistic. For the sake of clarity, frequency bands are depicted below the abscissa. Top row of (B) shows topoplots of statistically significant differences between sleep EEG power values of elderly women and men for all frequency bands of interest. Colored markings point to a statistical significance of the original, uncorrected test statistic; an additional black border indicates a significant difference after MCC based on the TFCE statistic. Corresponding topographical differences between sleep EEG power values of young end elderly men are displayed at the bottom row of (B). Red, blue, and green markings highlight higher sleep EEG power values in elderly women, elderly men, and young men, respectively. Ranges of the frequency bands are given as half-closed intervals, ie the interval contains one endpoint (squared bracket) but not the other (round bracket).
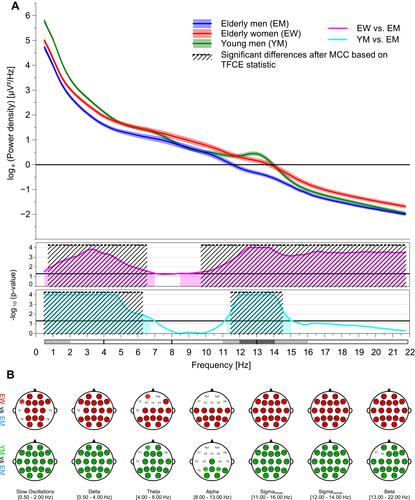
Figure 3 Age and sex effects on global (A) and regional (B) sleep EEG power recorded during stage REM sleep. For a detailed figure description, see the caption of .
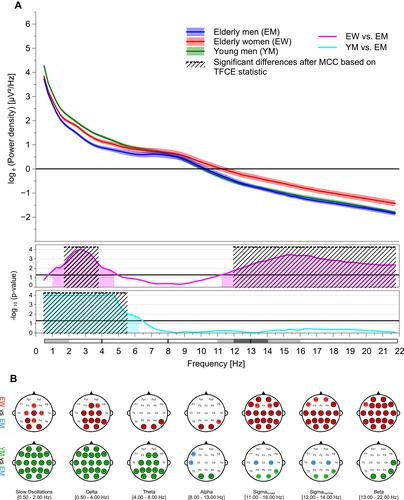
Figure 4 Age and sex effects on global (A) and regional (B) sleep EEG power recorded during the time spent awake between lights out and lights off. For a detailed figure description, see the caption of .
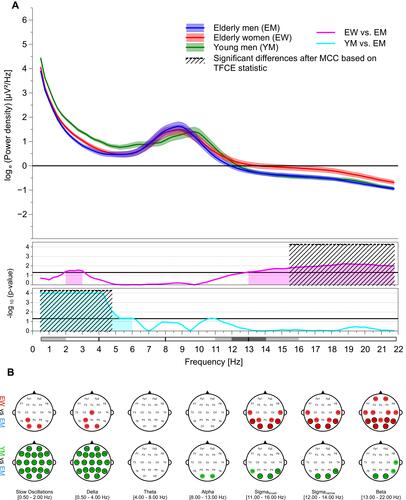
Figure 5 Age and sex effects on global (A) and regional (B) sleep EEG power recorded during stage N1 sleep. For a detailed figure description, see the caption of .
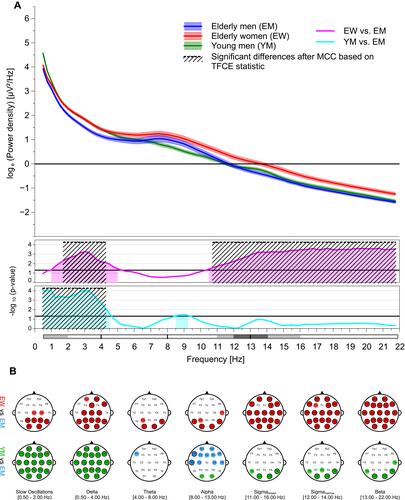
Figure 6 Age and sex effects on global (A) and regional (B) sleep EEG power recorded during stage N2 sleep. For a detailed figure description, see the caption of .
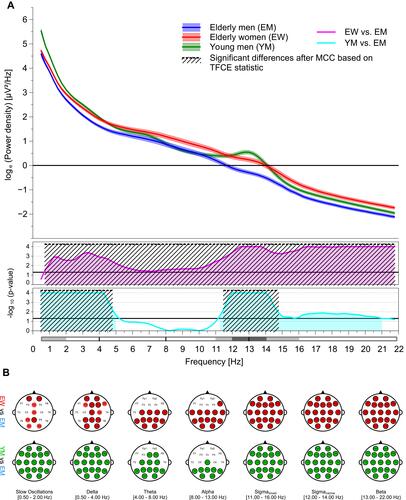
Figure 7 Age and sex effects on global (A) and regional (B) sleep EEG power recorded during stage N3 sleep. For a detailed figure description, see the caption of .