
Figures & data
Table 1 Baseline Characteristics of Subjects with Different Baseline OSA Status and Subtypes (N = 610)
Figure 1 Study flow chart.
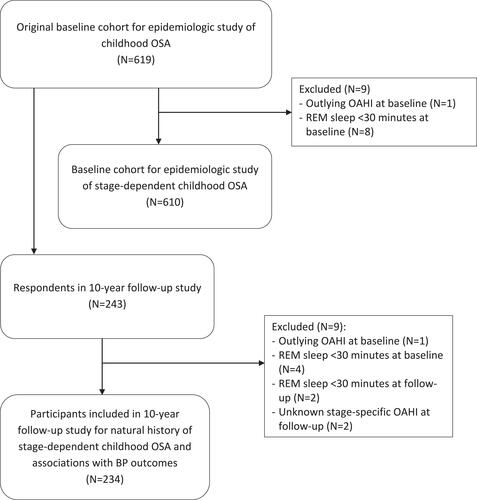
Table 2 Baseline and Follow-Up Characteristics of Subjects with Different Baseline OSA Status and Subtypes (N = 234)
Table 3 Characteristics at Follow-Up by SDB Status and Subtypes at 10-Year Follow-Up (N = 234)
Table 4 SDB Status and Subtypes at Baseline and Follow-Up (N = 234)
Table 5 Associations Between OSA Subtypes and Blood Pressure Among Participants from Both Visits (Pooled Data from Both Visits)
Table 6 Subgroup Analysis on the Associations Between OSA Subtypes and Nocturnal Systolic Blood Pressure Dipping Among Participants
Table 7 Associations Between OSA Subtypes and Blood Pressure Among Participants from Both Visits Using OAHI ≥5/h to define OSA(Pooled Data from Both Visits)