Figures & data
Table 1 Primer Sequence Details of the Analyzed Gene (F: Forward Primer, R: Reverse Primer)
Table 2 General Characteristics of the Study Participants
Figure 1 The percentage difference of morning-evening variation in clock gene expression for subjects with and without OSA. (A) expression of HIF1α increased by 23% in subjects with OSA when compared with those without OSA (P = 0.008) (B and C) Relative gene expression of Timeless (R = −0.223, P = 0.038) and Cry2 (R= −0.348, P = 0.012) in subjects with OSA decreased with increasing AHI. Data represent means ± SEM. **P < 0.01.
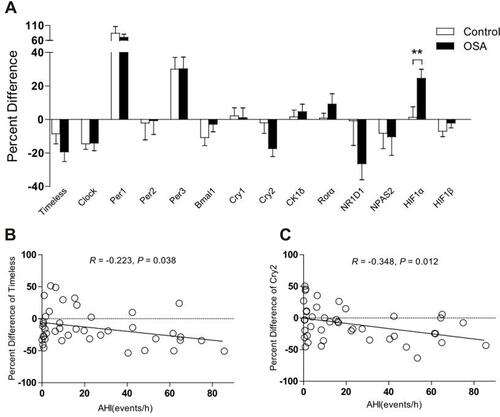
Figure 2 The percentage difference of morning-evening variation in clock gene expression for subjects with and without NH. (A-D) The percentage difference of Bmal1, Rorα, and HIF1α were up-regulated by 16% (P = 0.006), 14% (P = 0.027), and 25% (P = 0.005), respectively, in subjects with nocturnal hypoxemia. (E) The protein concentration of HIF1α was increased in patients with NH after one-night of hypoxia but did not reach a significant statistical difference. Data represent means ± SEM. * P < 0.05, ** P < 0.01.
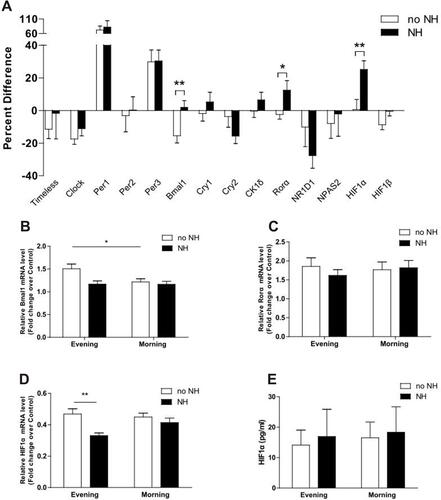
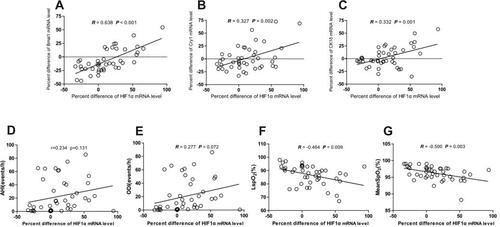
Figure 3 Correlations between morning-evening variation of HIF-1α and circadian genes mRNA levels (Bmal1, Cry1, and CK1δ), PSG parameters (AHI, ODI LSpO2, and Mean SpO2). (A–C) Correlation between morning-evening variation for HIF1α and Bmal1, Cry1, and CK1δ mRNA level (R = 0.638, P < 0.001; R = 0.327, P = 0.032; R = 0.332, P = 0.030, respectively). (D–G) Correlation between morning-evening variation for HIF1α mRNA level and PSG parameters (AHI, ODI, LSpO2, and Mean SpO2) (R = 0.234, P = 0.131; R = 0.277, P = 0.072; R = −0.464, P = 0.009; R = −0.500, P = 0.003, respectively).