
Figures & data
Figure 1 Schematic plot showing the possible factors contributing to the progression of myopia with ortho-k treatment.
Table 1 Comparisons of the Baseline Demographics Characteristics and Ocular Biometric Parameters Between Slow and Fast Progressions
Figure 2 Simple linear regression analysis between AL change and (A) baseline age, (B) baseline SE, (C) average near-work distance per day and (D) total PSQI. Trend lines are fitted using binary linear regression (yellow–green lines).
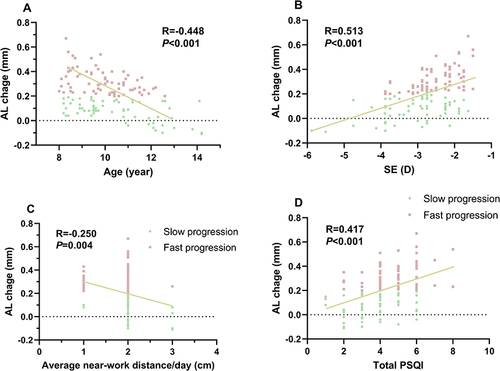
Table 2 Multivariable Regression Analysis Showing the Strength of the Factors Related with Axial Length Growth
Table 3 Multivariable Regression Analysis Showing the Strength of the Factors Related with Fast Axial Elongation Incidence
Table 4 Subscales of PSQI in Slow and Fast Progression Groups of the Myopia Cases