Figures & data
Table 1 Baseline Characteristics (Demographic and Morbidity) of Patients by Study Groups
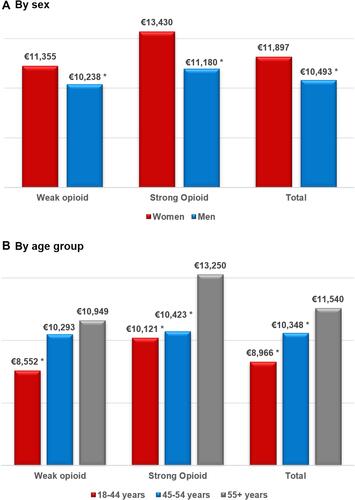
Figure 1 Study flow diagram.
Abbreviation: NRS, numeric rating scale.
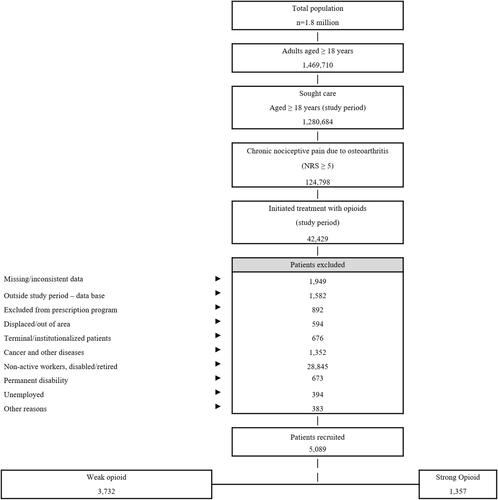
Table 2 Treatment Persistence and Adherence, Medication Possession Ratio and Discontinuation by Study Groups
Table 3 Days of Sick Leave and Annual Cost Due to Lost Productivity
Table 4 Mean Adjusted Productivity Costs (€/Patient) During the Follow-Up Period in Different Scenarios
Figure 2 Mean cost per patient (€) of sick leaves adjusted by covariates during follow up (36 months) by sex (A) and age group (B).
Notes: Values expressed as means. *p <0.05 (reference cohort: females and 55+ years, respectively). Not significant when not indicated.