Figures & data
Figure 1 Histogram shows the frequency of prediction error.
Abbreviation: SD, standard deviation.
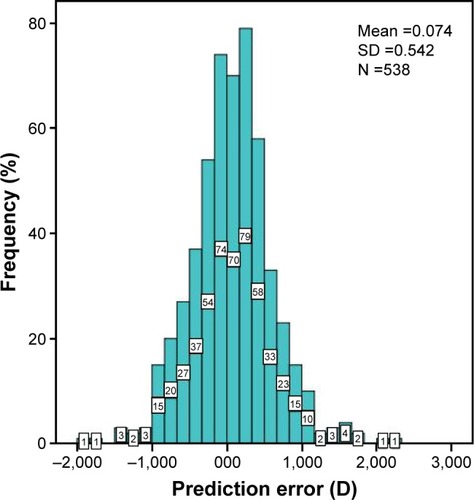
Table 1 Distribution of the prediction error (difference between attempted and achieved SE) in medium eyes using SRK/T formula and ultrasound biometry (n=538)
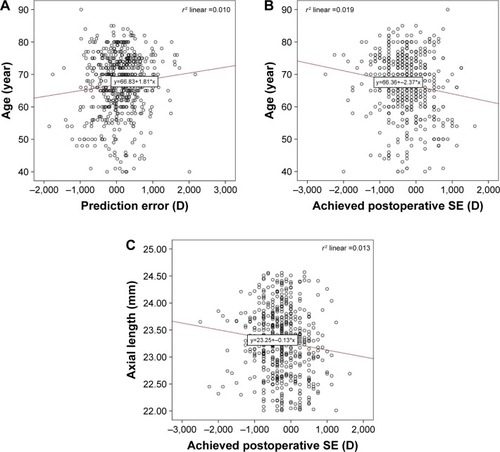
Figure 2 (A) Scatter plot of prediction error versus age; (B) achieved postoperative SE versus age; (C) achieved postoperative SE versus AL.
Abbreviations: AL, axial length; D, diopter; SE, spherical equivalent.