Figures & data
Figure 1 Different levels of signal quality resulting from optical biometry. Abbreviations: AL, axial length; SNR, signal-to-noise ratio.
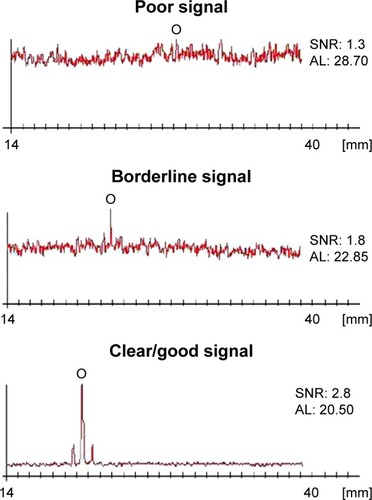
Table 1 Mean, standard deviation and difference in mean of AL and IOL power from IOL Master and US biometry
Table 2 Paired t-test comparing mean of AL obtained from IOL Master and US biometry
Figure 2 Box plots comparing corresponding data obtained from IOL Master and US biometry.
Notes: Left-sided values are obtained by IOL Master, and right-sided values are obtained by US biometry. (A) IOL calculation; (B) Axial length.
Abbreviations: IOL, intraocular lens; US, ultrasound.
Abbreviations: IOL, intraocular lens; US, ultrasound.
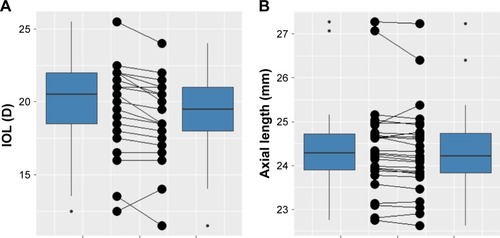
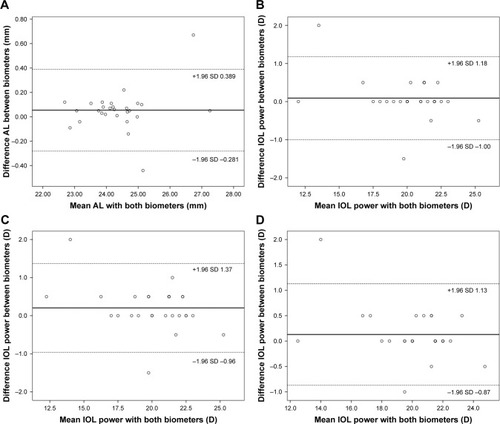
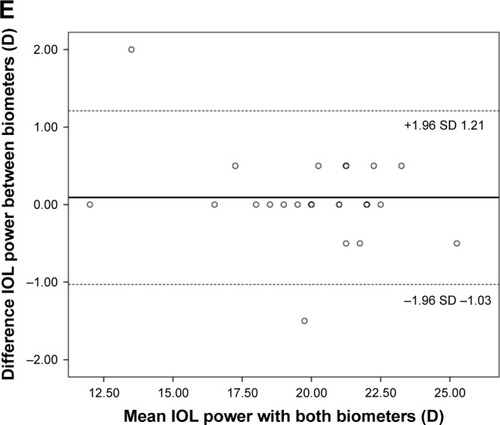
Figure 3 Bland–Altman Plots demonstrating the agreement between IOL Master and US biometry.
Notes: (A) Bland–Altman plot for axial length. (B) Bland–Altman plot for IOL power using the Holladay 1 formula. (C) Bland–Altman plot for IOL power using the Hoffer Q formula. (D) Bland–Altman plot for IOL power using the SKR-T formula. (E) Bland–Altman plot for IOL power using the average of 3 formulae.
Abbreviations: IOL, intraocular lens; US, ultrasound.
Abbreviations: IOL, intraocular lens; US, ultrasound.