Figures & data
Table 1 Demographics of patients involved in the study
Figure 1 Interval changes in (A) macular thickness, and (B) mean perfused ratio at baseline, 6, 12, and 24 months in the control and anti-VEGF groups. P-value: control group differences between baseline and follow-up measurements, paired t-test. P’-value: anti-VEGF group differences between baseline and follow-up measurements, paired t-test.
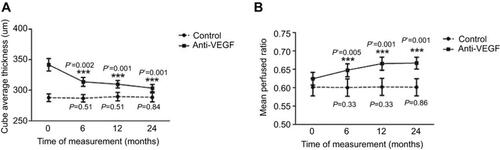
Figure 2 Interval changes in cup volume measured on optical coherence tomography (OCT) at baseline, 6, 12, and 24 months in the control and anti-VEGF groups. P-value: control group differences between baseline and follow-up measurements, paired t-test. P’-value: anti-VEGF group differences between baseline and follow-up measurements, paired t-test.
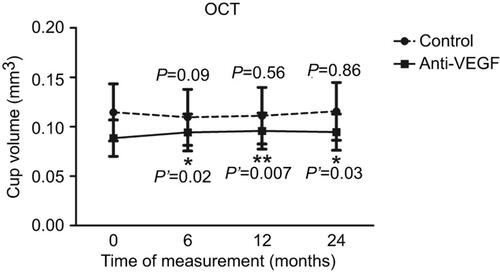
Figure 3 Interval changes in vertical cup/disk ratio measured on optical coherence tomography (OCT) at baseline, 6, 12, and 24 months in the control and anti-VEGF groups. P-value: control group differences between baseline and follow-up measurements, paired t-test. P’-value: anti-VEGF group differences between baseline and follow-up measurements, paired t-test.
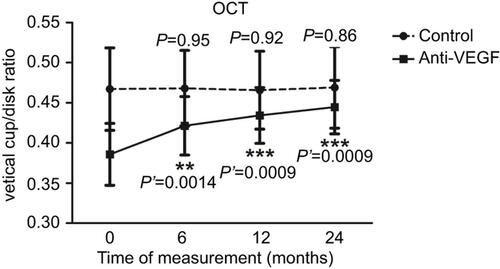
Figure 4 Interval changes in vertical cup/disk ratio measured on optical coherence tomography at baseline, 6, 12, and 24 months in participants receiving less than ten injections and ten or more injections. P-value: differences between baseline and follow-up measurements of participants receiving less than ten injections, paired t-test. P’-value: differences between baseline and follow-up measurements of participants receiving ten or more injections, paired t-test.
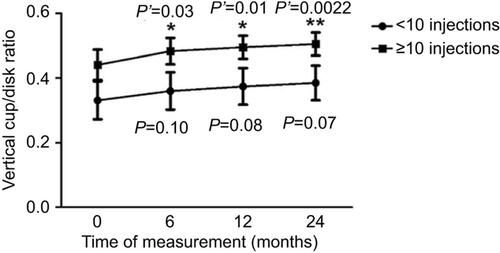
Figure 5 Interval changes in vertical cup/disk ratio measured by two masked glaucoma specialists using stereo-photographs at baseline, 6, 12, and 24 months in the (A) anti-VEGF group and the (B) control group. P-value: grader 1 differences between baseline and follow-up measurements, paired t-test. P’-value: grader 2 differences between baseline and follow-up measurements, paired t-test.
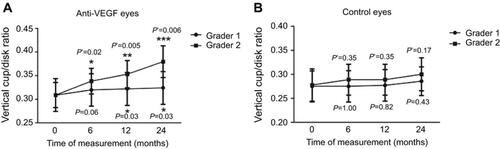
Figure 6 Interval changes in mean deviation measured on the (A) Humphrey Visual Field Analyzer and (B) visual acuity at baseline, 6, 12, and 24 months in the control and anti-VEGF groups. p-value: control group differences between baseline and follow-up measurements, paired t-test. p’-value: anti-VEGF group differences between baseline and follow-up measurements, paired t-test.
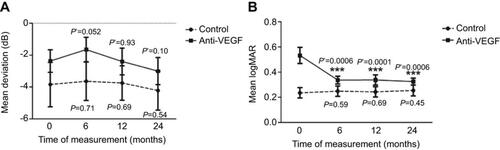
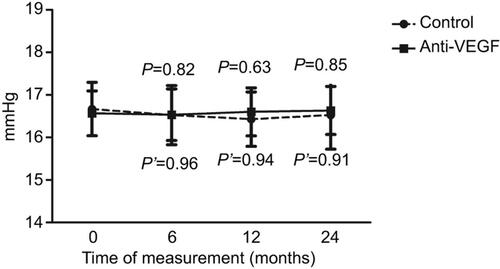
Figure 7 Interval changes in intraocular pressure at baseline, 6, 12, and 24 months in the control and anti-VEGF groups. P-value: control group differences between baseline and follow-up measurements, paired t-test. P’-value: anti-VEGF group differences between baseline and follow-up measurements, paired t-test.