Figures & data
Table 1 Demographic, tomographic and epithelial thickness data
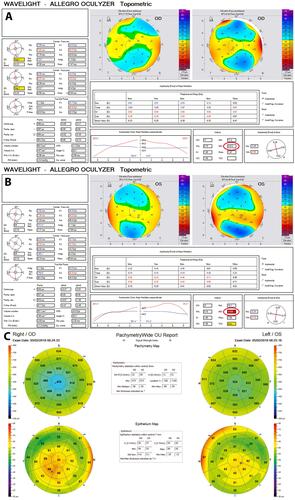
Figure 1 (A and B) Topometric map of the right and left eye of one patient. Note the abnormal IHD and the borderline keratoconus classification in both eyes. (C) Epithelial map of the right and left eye of the same patient; note the relative epithelial thickening inferiorly corresponding to the steep areas noted in A and B.
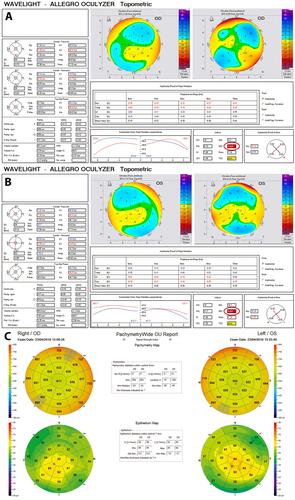
Figure 2 (A and B) Topometric map of the right and left eye of another patient. Note the abnormal IHD in both eyes, and the borderline keratoconus classification in right eyes. (C) Epithelial pachymetry map of both eyes of the second patient. Note the relative epithelial thickening inferiorly corresponding to the steep areas noted in A and B.
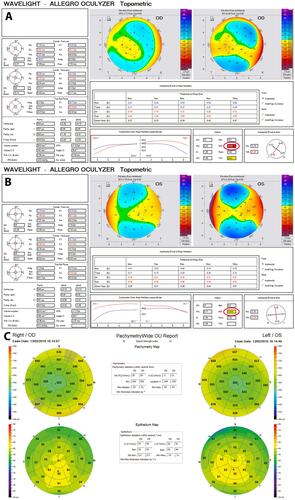
Figure 3 (A and B) Topometric map of the right and left eye, 7 years post PRK of the right eye. (C) Epithelial pachymetry map of both eyes. Note the relative epithelial thickening inferiorly corresponding to the steep areas noted in A and B.