
Figures & data
Figure 1 Real example of microperimetry performed for the study in a right eye. Microperimetric results of the right eye of a healthy subject. Retinal sensitivity is represented on the studied point in green color by a number and express in decibels.
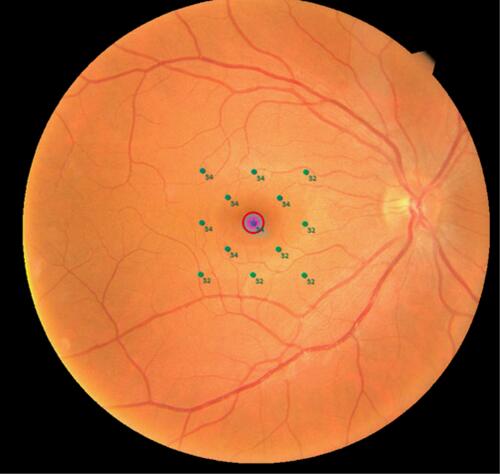
Figure 2 Customized 13-points-grid for microperimetry for right and left eyes. Diagram showing the location of each studied point in the microperimetric exam. The microperimetry covers the 4.5×4.5 mm of the central macula. Note that in each area of the macula the grid is named equally to the same grid in the other eye in order to analyze them as the same topographic area.
Abbreviation: RS, retinal sensitivity.
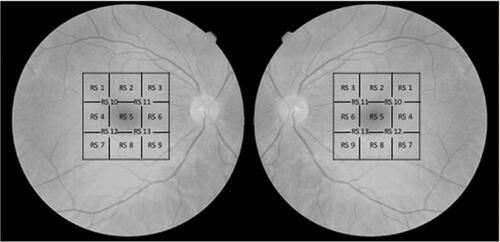
Figure 3 Nine-sectors-grid for vessel density measured by OCT-A for right and left eyes. Diagram showing the location of each studied sector in the OCT-A. The exam covers the 4.5×4.5 mm of the central macula. Note that in each area of the macula the grid is named equally to the same grid in the other eye in order to analyze them as the same topographic area. Also, correlation between OCT-A and microperimetry are calculated following this grid.
Abbreviation: S, sector.
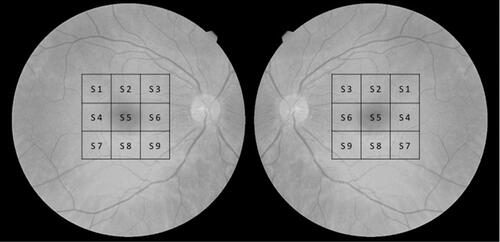
Table 1 Patients Demographics And Clinical Characteristics Of Diabetic Patients With Diabetic Retinopathy And Non-Diabetic Controls
Table 2 Vessel Density In Superficial Capillary Plexus In The 9-Areas-Grid In Diabetic Retinopathy And Controls
Table 3 Mean Vessel Density In Deep Capillary Plexus In The 9-Areas-Grid In Diabetic Retinopathy Group And Healthy Control Group
Table 4 Mean Retinal Sensitivity In Each Point Of The 13-Points-Grid In Diabetic Retinopathy Group And Control Group