Figures & data
Figure 1 The iLUX MGD Treatment System. Reproduced with permission of Alcon.
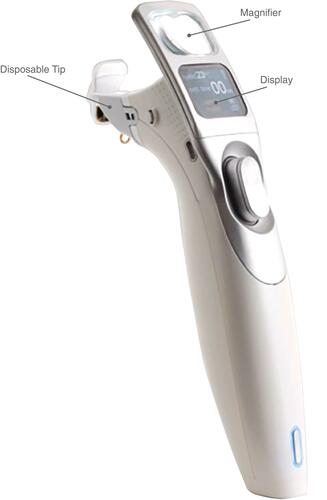
Figure 2 CONSORT flow diagram presenting patient enrollment at each phase of the study for both the Lipiflow and iLUX treatment groups.
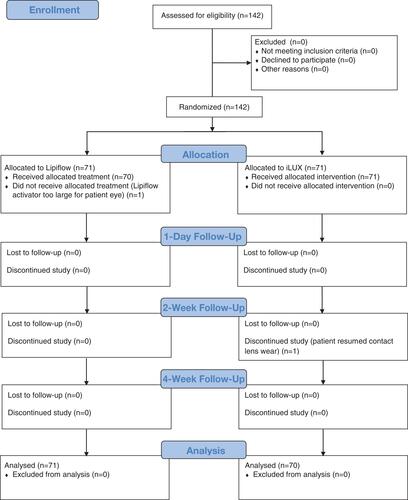
Table 1 Mean Meibomian Gland Scores (±SD) at Each Study Visit for Patients Treated with iLUX and LipiFlow. Change from Baseline at Weeks 2 and 4 are Also Shown Along with 95% Confidence Intervals
Figure 3 Mean ± SD Meibomian Gland Scores in the right eyes of subjects in the iLUX and LipiFlow groups at baseline and 2 and 4 weeks after treatment.
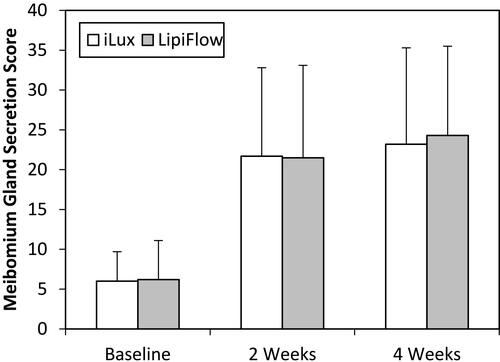
Table 2 Mean Tear Break-Up Time (±SD) in Seconds at Each Study Visit for Patients Treated with iLUX and LipiFlow. Change from Baseline at Weeks 2 and 4 are Also Shown Along with 95% Confidence Intervals
Figure 4 Mean ± SD tear break-up times in the right eyes of subjects in the iLUX and LipiFlow groups at baseline and 2 and 4 weeks after treatment.
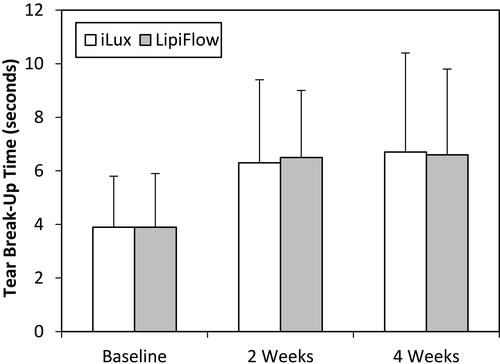
Table 3 Mean Ocular Surface Disease Index Scores (±SD) at Each Study Visit for Patients Treated with iLUX and LipiFlow. Change from Baseline at Weeks 2 and 4 are Also Shown Along with 95% Confidence Intervals
Figure 5 Mean ± SD Ocular Surface Disease Index scores of subjects in the iLUX and LipiFlow groups at baseline and 2 and 4 weeks after treatment.
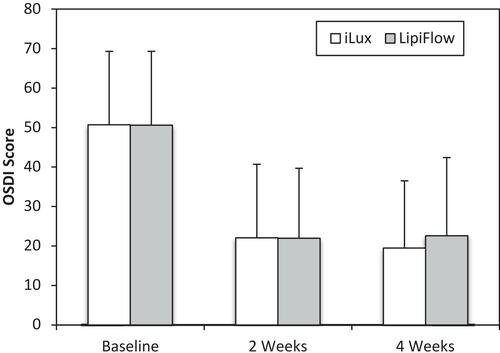
Table 4 Mean Pain Scores (±SD) at Each Study Visit for Patients Treated with iLUX and LipiFlow. Changes from Baseline at 1 Day and 2 and 4 Weeks are Also Shown Along with Their 95% Confidence Intervals. The Post-Treatment Ratings Refer to Pain During the Procedure and are Not Compared with Baseline Values
Table 5 Mean Discomfort Scores (±SD) at Each Study Visit for Patients Treated with iLUX and LipiFlow. Changes from Baseline at 1 Day and 2 and 4 Weeks are Also Shown Along with Their 95% Confidence Intervals. The Post-Treatment Ratings Refer to Discomfort During the Procedure and are Not Compared with Baseline Values
Table 6 Mean Corneal Staining Scores (±SD) at Each Study Visit for Patients Treated with iLUX and LipiFlow. Post-Treatment Changes from Baseline Along with Changes After 1 Day and 2 and 4 Weeks are Also Shown, Along with Their 95% Confidence Intervals
Table 7 Mean Visual Acuity (±SD) in logMAR at Each Study Visit for Patients Treated with iLUX and LipiFlow. Post-Treatment Changes from Baseline Along with Changes After 1 Day and 2 and 4 Weeks are Also Shown, Along with Their 95% Confidence Intervals
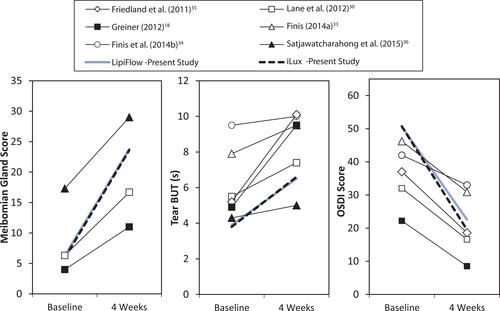
Figure 6 Mean meibomian gland scores (MGS), tear break-up time (TBUT) and OSDI scores before and 4 weeks after treatment with the LipiFlow device in the present study and in six previous studies.
Note: The plots are presented to demonstrate baseline variations and reported changes with treatment; however, the relationship between baseline and 4 weeks for all measurement cannot be assumed to be linear.