Figures & data
Table 1 Comparison of Means of Baseline Corneal Epithelial Thickness for Diabetic and Nondiabetic Groups
Table 2 Mean Change in Epithelial Thickness on the First Postoperative Day
Table 3 Mean Change in Epithelial Thickness 1 Week Postoperatively in Comparison with the First Postoperative Day
Table 4 Mean Change in Epithelial Thickness 1 Month Postoperatively in Comparison with the first Postoperative Week
Figure 1 SD-OCT of one patient on the first postoperative day, showing both epithelial and corneal thickness maps, with significant increase in thickness.
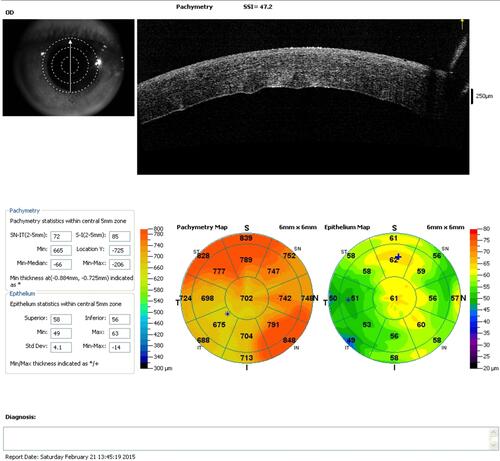
Table 5 Correlations Between Each Corneal Zone and Others on All Measurements
Figure 2 Epithelial thickness changes in both groups throughout the study period. (A) Group A (diabetic patients); (B) group B (nondiabetic patients).
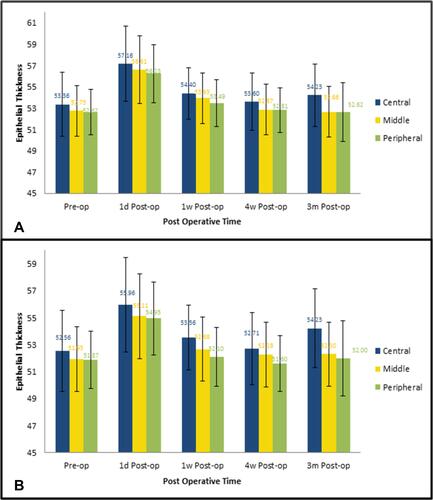
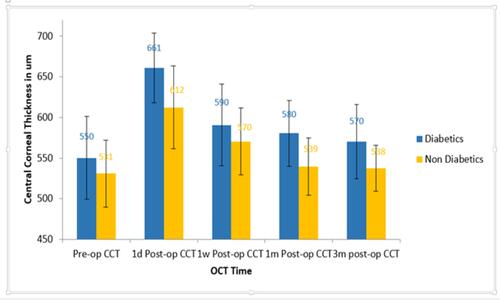
Figure 3 Central corneal thickness changes throughout the study period in both groups.