
Figures & data
Figure 1 Color 45° fundus photograph of an eye taken with optical coherence tomography (HOCT-1F) without pupil dilation.
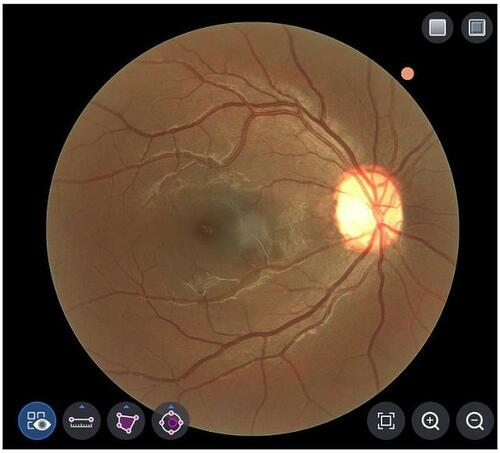
Figure 2 Spectral domain optical coherence tomography scan from a healthy patient taken with the HOCT-1F which shows the segmentation for retinal measurements; blue line represents the outer limit for the retinal segmentation.
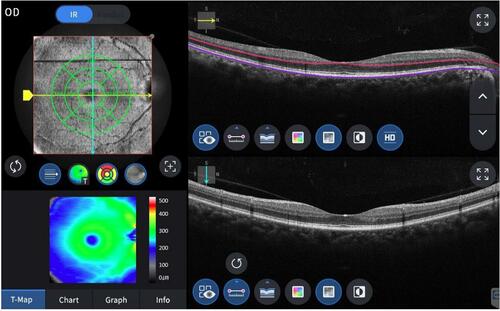
Table 1 Patient Demographic and Eye Characteristics
Table 2 Macular Thickness Stratified by Sex
Table 3 Macular Thickness Stratified by Age Groups
Table 4 Mean Macular Thickness Stratified by Age Groups and Sex
Figure 3 Regression plot of central subfield thickness vs age.
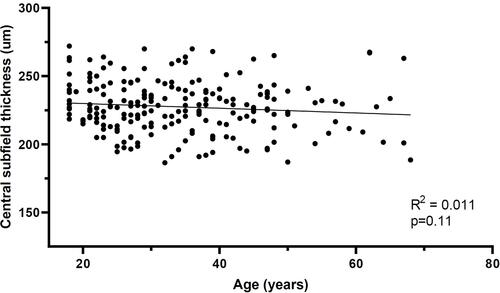
Table 5 Comparative Sample from Studies that evaluate Central Subfield Thickness in Different Populations Using Different Spectral Domain Optical Coherence Tomography Units