
Figures & data
Table 1 BTA Dosages and Their Corresponding Angles of Deviation
Figure 1 Total participants: males (n=23) females (n=33).
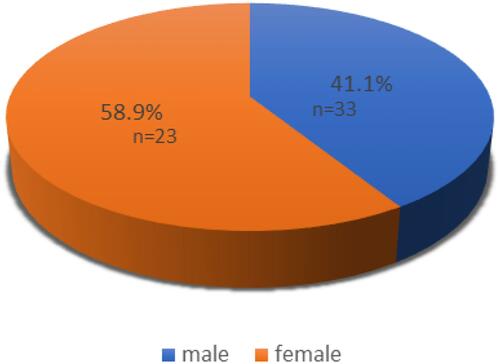
Figure 2 Percentages of the diagnoses from the total number.
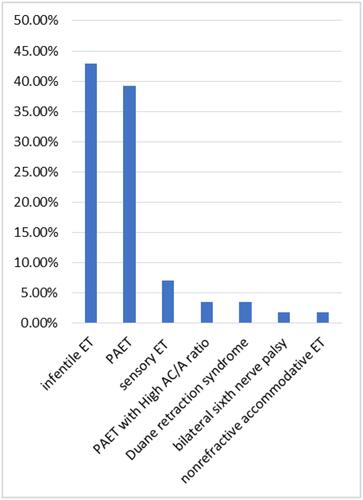
Table 2 Success Rate in Regard to the BTA Dose
Table 3 Success and Failure in Regard to Gender
Table 4 Success Rate in Regard to the Diagnosis
Table 5 The Mean Pre-Treatment and Post-Treatment Deviations, Mean Reduction and Percentage of Improvement from Initial Deviations (± Standard Deviation) with Regard to the Change in BTA Dose
Table 6 The Mean Pre-Treatment and Post-Treatment Deviations, Mean Reduction and Percentage of Improvement from Initial Deviations (± Standard Deviation) with Regard to the Change in Diagnosis
Table 7 Dose and Lid Position in First Visit