
Figures & data
Table 1 Inclusion and Exclusion Criteria
Figure 1 Schematic representation of choroidal thickness measurement. Choroidal Thickness was measured from the outer edge of the hyperreflective line, corresponding to the retinal pigment epithelium, to the choroidal-scleral junction. Measurements were taken at the subfoveal choroid and at 500 µm intervals from the fovea: temporal 500 µm (T500), 1000 µm (T1000), 1500 µm (T1500) and nasal 500 µm (N500), 1000 µm (N1000) and 1500 µm (N1500).
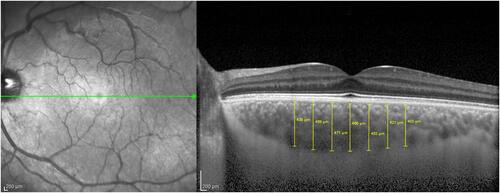
Table 2 Summary of the Characteristics of the Patients’ Sample and Characterization of Tomographic Indices
Table 3 Distribution of Atopic Conditions in Keratoconus Patients
Table 4 Characterization of Tomographic Indices in Atopic and Non-Atopic Groups
Figure 2 Boxplot results of each choroidal point analyzed in atopic and non-atopic groups. Results are expressed as median (± SD). Measurements undertaken at subfoveal (Fov), temporal 500 μm (T500), 1000 μm (T1000), 1500 μm (T1500), and nasal 500 μm (N500), 1000 μm (N1000), and 1500 μm (N1500). Atopic patients show thicker choroids in every analyzed point, although the differences are not statistically different.
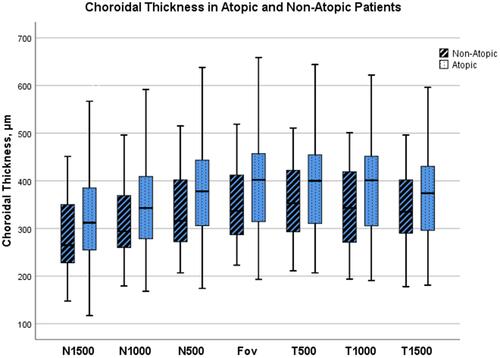
Table 5 Multivariable Linear Regression Analysis
Table 6 Subfoveal Choroidal Thickness According to Eye Rubbing Habits