
Figures & data
Figure 1 Optical coherence tomography angiography (OCT-A) images. (A) OCT-A 3 mm x 3 mm scans showing vascular perfusion (VP) (green pixels) in superficial capillary plexus (SCP). The grid shows center (1 mm diameter circle, centered in fovea) and perifoveal ring (1 mm to 3 mm from fovea). (B) OCT-A 3 mm x 3mm scans showing vascular density (VD) (red lines, (B) SCP. The grid shows center (1 mm diameter circle, centered in fovea) and perifoveal ring (1 mm to 3 mm from fovea). (C) OCT-A 4.5 mm x 4.5 mm scan showing VP (white pixels) in peripapillary capillary plexus. The grid shows peripapillary ring (1.5 mm to 4.5 mm from disc center). (D) OCT-A 6 mm x 6 mm scans showing VP (green pixels) in deep capillary plexus (DCP). The grid shows center (1 mm diameter circle, centered in fovea), perifoveal ring (1 mm to 3 mm from fovea) and parafoveal ring (3 mm to 6 mm from fovea). E. OCT-A 6 mm x 6 mm scans showing VD (red lines, (E) in deep capillary plexus (DCP). The grid shows center (1 mm diameter circle, centered in fovea), perifoveal ring (1 mm to 3 mm from fovea) and parafoveal ring (3 mm to 6 mm from fovea).
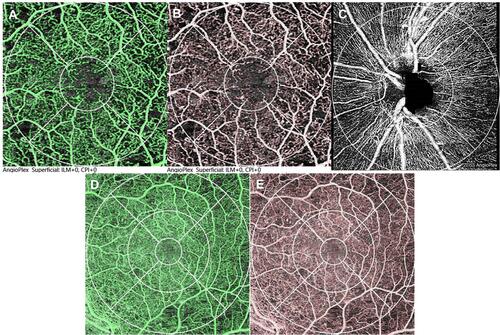
Table 1 Main Baseline Demographic and Clinical Characteristics
Table 2 Overview of Vessel Density in the Superficial Capillary Plexus in 3 mm × 3 mm and 6 mm × 6 mm Scans. P Values were Calculated Using Repeated Measures ANOVA and the Greenhouse–Geisser Correction
Table 3 Overview of the Vascular Perfusion (VP) in the Superficial Capillary Plexus in 3 mm × 3 mm and 6 mm × 6 mm Scans. P values were Calculated Using Repeated Measures ANOVA and the Greenhouse–Geisser Correction
Table 4 Overview of the Vascular Perfusion in the Deep Capillary Plexus Over the Course of the Study Follow-Up. P values were Calculated Using Repeated Measures ANOVA and the Greenhouse–Geisser Correction
Table 5 Overview of the Foveal Avascular Zone (FAZ) Area and Circularity in the Superficial Plexus. And 6 mm × 6 mm Scan (B) Over the Course of the Study Follow-Up. P values were Calculated Using Repeated Measures ANOVA and the Greenhouse–Geisser Correction
Figure 2 Vessel density in the 6 mm × 6 mm perifoveal ring (left) and vascular perfusion in the superficial capillary plexus (SCP) and deep capillary plexus (DCP) in the 6 mm × 6 mm perifoveal ring (right). Vertical bars represent 95% confidence interval. *p<0.005 as compared to baseline (Repeated measures ANOVA and the Greenhouse–Geisser correction). †<p<0.01 as compared to baseline (Repeated measures ANOVA and the Greenhouse–Geisser correction).
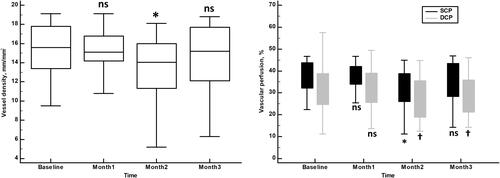
Table 6 Overview of the Best-Corrected Visual Acuity (BCVA), Macular Volume (MV), and Central Choroidal Thickness Over the Course of the Study Follow-Up. P values were Calculated Using Repeated Measures ANOVA and the Greenhouse–Geisser Correction
Table 7 Correlation Coefficient of Mean Changes in Best-Corrected Visual Acuity (BCVA) and Central Macular Thickness (CMT) with Baseline Vascular Parameters. Correlation Coefficient Have Been Adjusted by Age and Duration of Diabetes