Figures & data
Table 1 Summary of the Mean, SD, Minimum and Maximum Values for the Visual Acuity Measurement Techniques and the Time to Measure Them
Figure 1 (left): Sample display of HOTV optotypes with flanking bars using EyeSpy 20 software, (right): sample display of Sloan optotypes with flanking bars using EyeSpy 20 software (letters are reversed for projection onto the exam lane mirror).
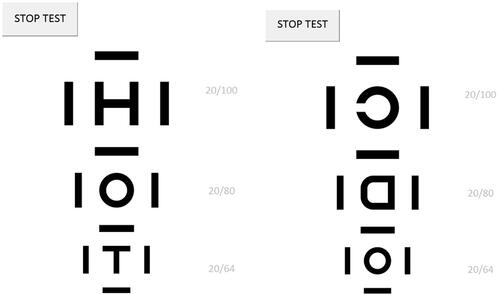
Figure 2 Bland–Altman plot demonstrating repeatability of logMAR visual acuity from EyeSpy 20 that shows the mean delta (solid line) and 95% limits of agreement, or ±1.96 × SD (dotted lines).
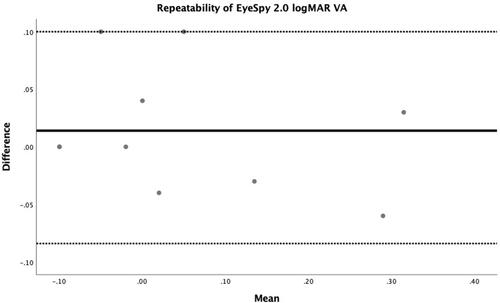
Figure 3 Correlation plot between visual acuity measured with EyeSpy 20 and e-ETDRS.
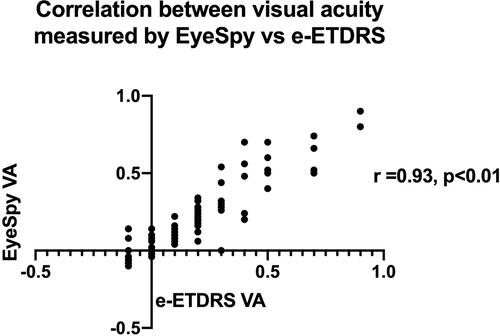
Figure 4 Bland–Altman plot comparing visual acuity between EyeSpy 20 and e-ETDRS that shows the mean delta (solid line) and 95% limits of agreement, or ±1.96 × SD (dotted lines).
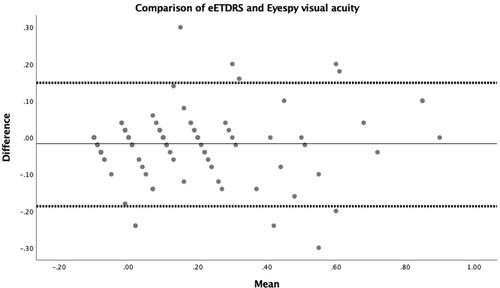
Figure 5 Plot of mean difference in logMAR visual acuity between EyeSpy 20 and e-ETDRS demonstrating the highest frequencies within logMAR 0 (±0.04).
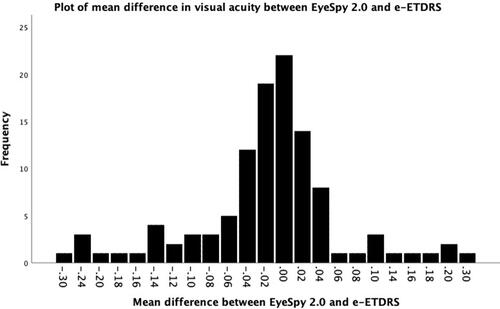
Figure 6 Plot of frequency of EyeSpy visual acuity of the subjects demonstrating varying levels of best corrected visual acuity.
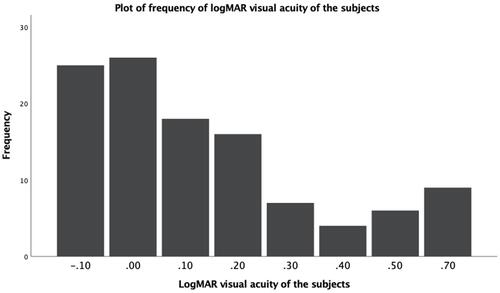
Figure 7 Plot of the correlation between e-ETDRS and EyeSpy for moderate and poor loss conditions with best corrected visual acuity.
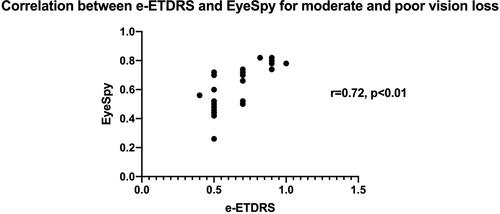
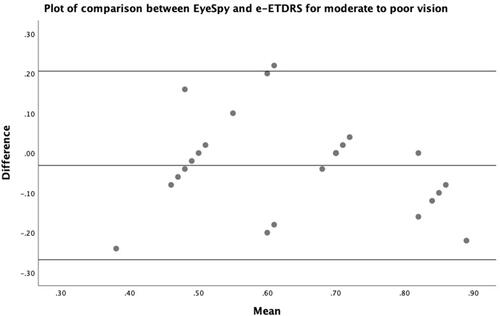
Figure 8 Bland–Altman plot comparing the Eyespy and e-ETDRS in subjects with moderate to poor vision.