Figures & data
Table 1 The Composition of the Oral Supplement. The Units are All in mg. PBS Was Used as Vehicle, and the Mice of Control Group Were Taken Same Volume of PBS
Figure 1 Oral supplementation reduced lipid peroxidation after NMDA injury. The amount of MDA in the retina was evaluated with a TBARS assay 6 hours after the intravitreal injection of NMDA without supplementation or with a low- or high-dose supplement (16 mg/kg, 160 mg/kg). The average amount of MDA was calculated and is shown per mg of retinal protein (each group: n = 6). Data represent mean ± SD. ***p < 0.001.
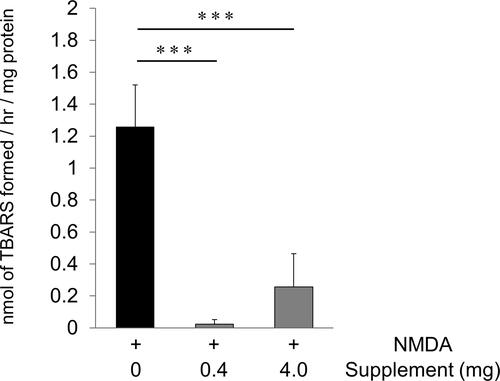
Figure 2 Oral supplementation reduced the cleavage of α-fodrin in the retina after NMDA injury. (A) Immunoblot analysis of α-fodrin in retinas without supplementation or with a low- or high-dose supplement 6 hours after NMDA injury. Representative immunoreaction image with anti-α-fodrin showing intact α-fodrin (280 kDa) and calpain-cleaved fragmented α-fodrin (145 and 150 kDa). β-actin was used as an internal control. (B) The relative density of the cleaved-fodrin immunoreactive band. Relative density was based on the cleaved-fodrin immunoreactive band 6 hours after NMDA injection. Data represent mean ± SD (each group: n = 6). *p <0.05.
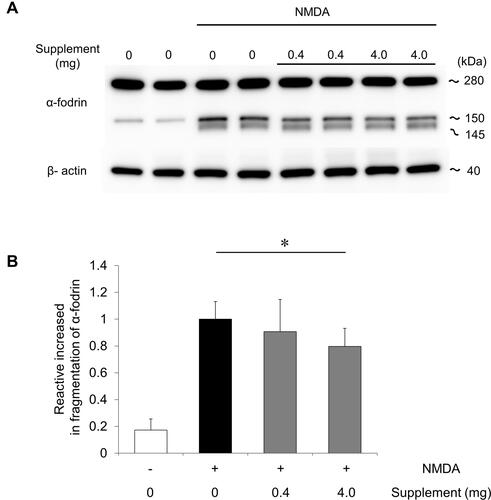
Figure 3 Decrease in TUNEL-positive cells after NMDA injury and supplementation. (A) Representative overlay photographs of retinal sections in mice with or without supplementation 24 hrs after NMDA injection. Red: TUNEL assay; blue: DAPI nuclear staining. Scale bar: 100 µm. (B) Histograms showing the TUNEL-positive cell count in the GCL of mice (non-supplementation group: n = 7, other groups: n = 8). Data represent mean ± SD, **P < 0.01, ***P < 0.001.
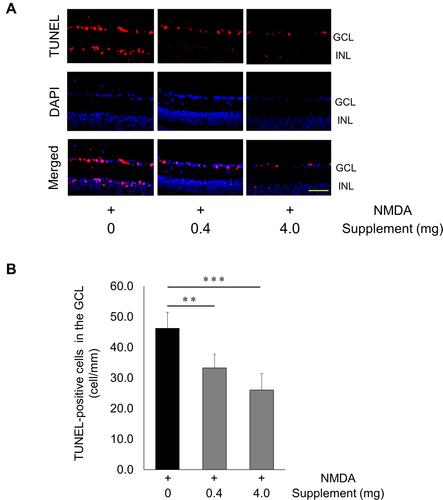
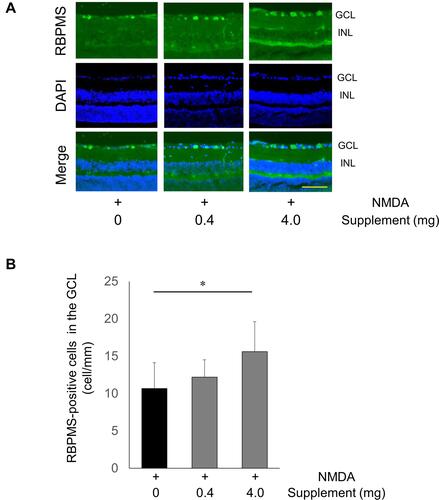
Figure 4 Increase in RBPMS-positive cells after NMDA injury and supplementation. (A) Representative images of RBPMS-positive RGCs 24 hours after the intravitreal injection of NMDA without supplementation or with a low- or high-dose supplement. GCL, ganglion cell layer; INL, inner nuclear layer. Scale bar: 100 µm. (B) Histogram showing the average number of RBPMS-positive cells in each group. Data represent mean ± SD (PBS, n = 8; low-dose supplement, n = 6; high-dose supplement, n = 8). *p <0.05.