Figures & data
Figure 1 Right eye of patient with drusen-associated GA imaged by color photograph (A), fundus autofluorescence (B), infrared reflectance (C), and OCT (D).
Notes: On color photography, sharp demarcation between regions of RPE loss and intact RPE is seen (blue arrows). Within the regions of GA, the large choroidal vessels are seen. (A) An area of relative foveal sparing, manifest as somewhat intact RPE, can be seen (yellow arrow). (B) Autofluorescence shows the peripheral margins of GA in high contrast from bright to black areas (blue arrows). The area of subfoveal RPE sparing is not well seen due to overlying retina luteal pigments blocking the blue excitation light (yellow arrow). Peripheral to the GA is an irregular mottled appearance of abnormal autofluorescence. (C) The infrared image also shows regions of GA with good contrast. (D) The OCT scan shows drusen in an area of intact RPE (yellow arrow), absence of the RPE in an area of GA (orange arrow), and a demarcation seen near the fovea where the intact RPE line ends at the margin of GA (blue arrow). The OCT B-scan corresponds to the horizontal green line of the infrared image (C).
Abbreviations: GA, geographic atrophy; RPE, retinal pigment epithelium; OCT, optical coherence tomography.
Abbreviations: GA, geographic atrophy; RPE, retinal pigment epithelium; OCT, optical coherence tomography.
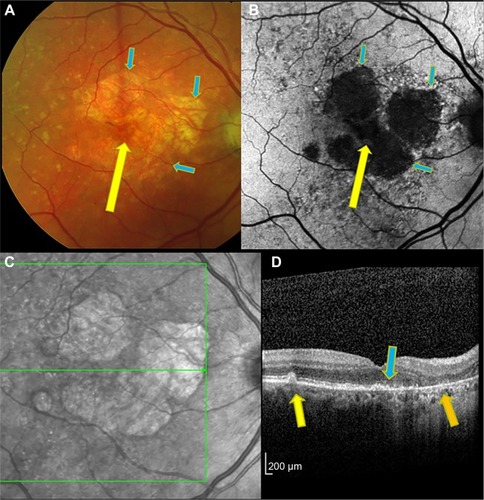
Figure 2 The same eye as shown in after 1 year.
Notes: The color image (A) shows slight increase in the margins and enlargement of the total area of GA. Autofluorescence imaging (B) also illustrates how the earlier GA regions have enlarged and begun to coalesce. The infrared image (C) likewise provides a good definition of the outer margins of the GA, whereas the area under the fovea is encroached upon by progressive atrophy. The OCT (D) shows that the margin of GA has advanced slightly toward the fovea compared to 1 year previously (blue arrow).
Abbreviations: GA, geographic atrophy; OCT, optical coherence tomography.
Abbreviations: GA, geographic atrophy; OCT, optical coherence tomography.
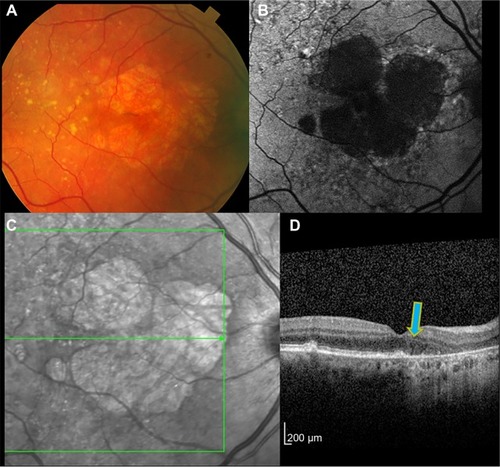
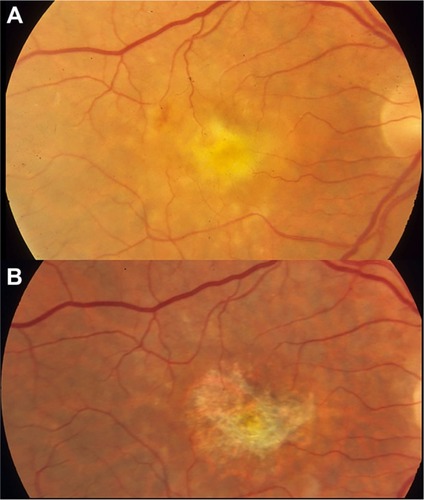
Figure 3 An eye with neovascularization-associated RPE atrophy at the baseline (A) and 30 months after anti-VEGF treatment (B).
Notes: With resolution of subretinal fluid, fibrin, and thin fibrovascular material at the baseline, the eye has developed marked RPE loss in the central macula.
Abbreviations: RPE, retinal pigment epithelium; VEGF, vascular endothelial growth factor.
Abbreviations: RPE, retinal pigment epithelium; VEGF, vascular endothelial growth factor.