Figures & data
Figure 1 Lapatinib inhibits the growth of several leukemia cell lines in a dose- and time-dependent manner.
Abbreviations: DMSO, dimethyl sulfoxide; MTS, 3-(4,5-dimethylthiazol-2-yl)-5-(3-carboxymethoxyphenyl)-2-(4-sulfophenyl)-2H-tetrazolium, inner salt; OD, optical density.
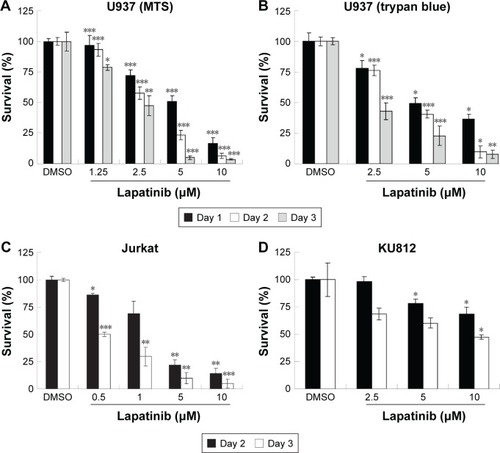
Figure 2 The induction of different death mechanisms by lapatinib in several kinds of leukemia lines.
Abbreviations: DMSO, dimethyl sulfoxide; MTS, 3-(4,5-dimethylthiazol-2-yl)-5-(3-carboxymethoxyphenyl)-2-(4-sulfophenyl)-2H-tetrazolium, inner salt; unTx, untreated.
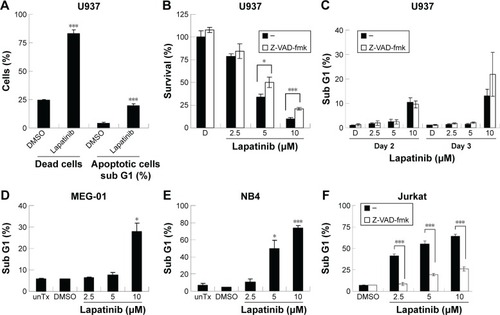
Figure 3 The induction of autophagic cell death by lapatinib in U937 cells.
Abbreviations: DMSO, dimethyl sulfoxide; TPA, 12-O-tetradecanoylphorbol-13-acetate; TG, thapsigargin; 3-MA, 3-methyladenine; MTS, 3-(4,5-dimethylthiazol-2-yl)-5-(3-carboxymethoxyphenyl)-2-(4-sulfophenyl)-2H-tetrazolium, inner salt.
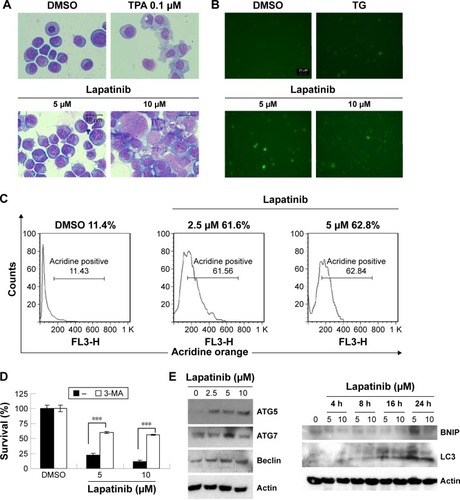
Figure 4 The induction of massive vacuoles inside cells by lapatinib in U937 cells.
Abbreviations: DMSO, dimethyl sulfoxide; TEM, transmission electron microscope.
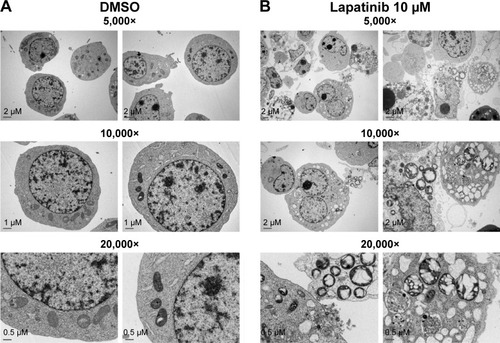
Figure 5 The RNAi-mediated downregulation of autophagy-related genes hinders lapatinib-induced autophagic cell death in U937 cells.
Abbreviations: RNAi, RNA interference; shRNA, short hairpin RNA; DMSO, dimethyl sulfoxide; MTS, 3-(4,5-dimethylthiazol-2-yl)-5-(3-carboxymethoxyphenyl)-2-(4-sulfophenyl)-2H-tetrazolium, inner salt; Unif, uninfected cells.
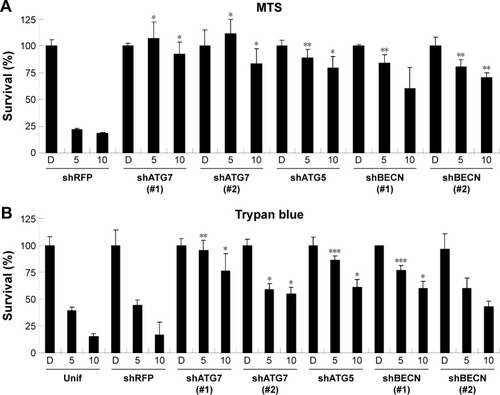
Figure 6 The upregulation of CD14 and CD68 macrophagic differentiation markers and the phagocytosis ability of lapatinib in AML U937 leukemia cells.
Abbreviations: AML, acute myeloid leukemia; DMSO, dimethyl sulfoxide; TPA, 12-O-tetradecanoylphorbol-13-acetate; DCFH-DA, 2′,7′-dichlorofluorescein diacetate; ROS, reactive oxygen species; MFI, mean fluorescence intensity.
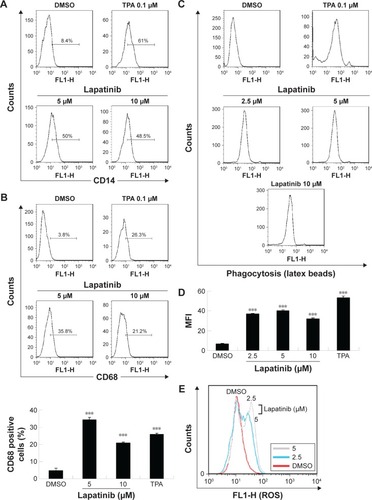
Figure 7 The synergistic effects of lapatinib and other cytotoxic drugs in U937 leukemia cells.
Abbreviations: DMSO, dimethyl sulfoxide; MTS, 3-(4,5-dimethylthiazol-2-yl)-5-(3-carboxymethoxyphenyl)-2-(4-sulfophenyl)-2H-tetrazolium, inner salt.
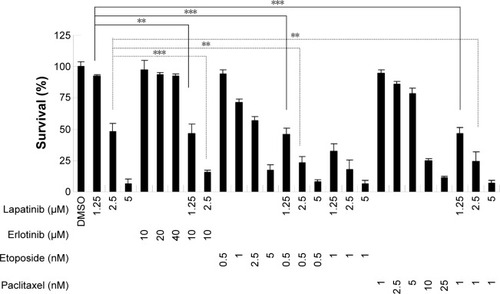
Figure S1 Lapatinib-induced mitochondria collapse in U937 cells.
Notes: U937 cells were treated with DMSO or 2.5 µM lapatinib for 2 days. Cells were stained with DiOC6 (molecular probes) and the MTP inside the cells was analyzed by flow cytometry.
Abbreviations: DMSO, dimethyl sulfoxide; MTP, mitochondria transmembrane potential.
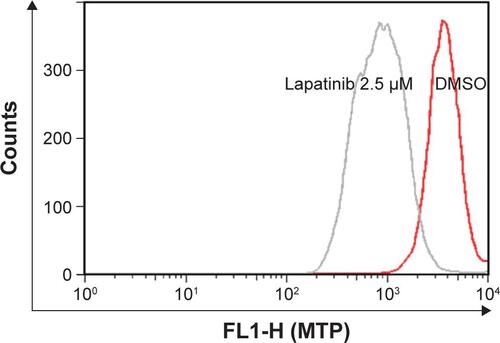
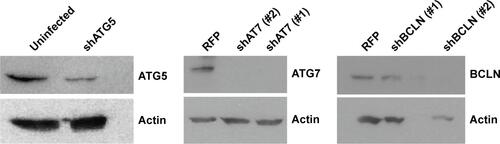
Figure S2 Expression of ATG7, ATG5, and BCLN in shRNA knockdown cells.
Notes: U937 cells with shRNA expression as indicated were prepared. Cell lysates from shRNA expressing U937 cells were collected and subjected to Western blot analysis for determining the expression of ATG7, ATG5, BCLN, and actin (loading control). Two shATG7 or shBECN clones (#1 or #2) were used.
Abbreviations: BCLN, Beclin-1; shRNA, short hairpin RNA.