Figures & data
Table 1 Disease characteristics of five colorectal patients selected for TEC isolation
Figure 1 The PD-1 expression on ex vivo expanded CD8+ T cells obtained from patient’s blood before surgery.
Abbreviations: mAb, monoclonal antibody; ns, not significant.
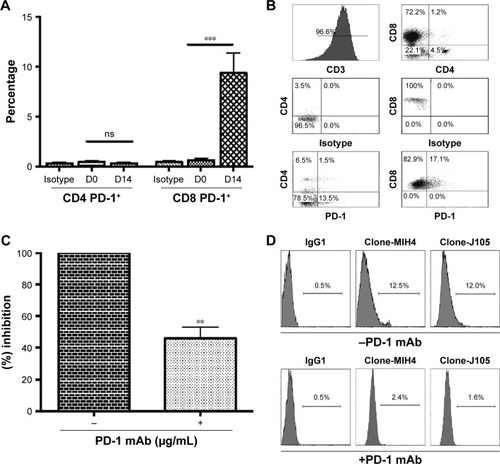
Figure 2 Apoptotic effect of CD8+ T cells on EpCAM+ tumor cells after PD-1 blockade for 48 hrs.
Abbreviations: mAb, monoclonal antibody; TECs, tumor epithelial cells; MSI-H, high microsatellite instability.
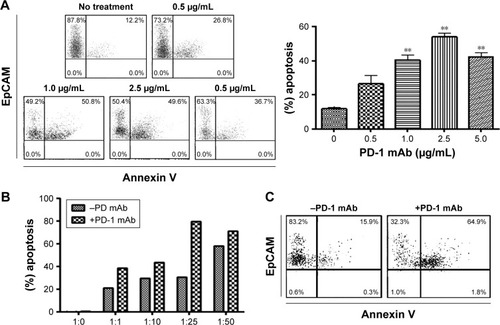
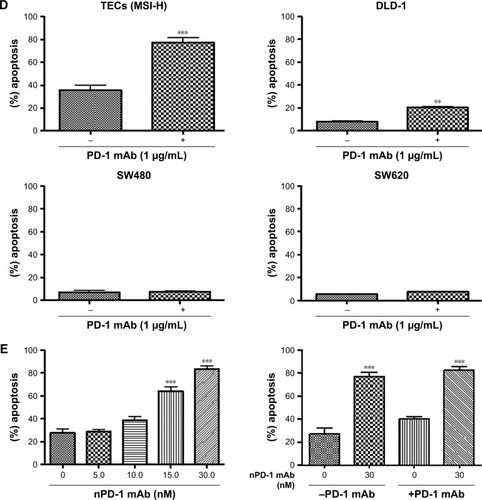
Figure 3 Effect of PD-1 mAb on cytolytic IFN-γ, GrB, and CD107a.
Abbreviations: mAb, monoclonal antibody; TECs, tumor epithelial cells.
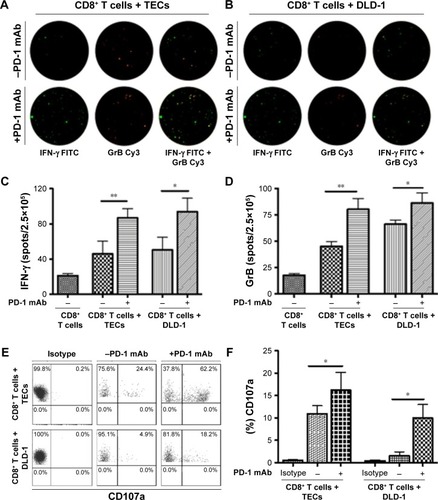
Figure 4 Cellular interactions, cytosolic uptake, and CD8+ T cells’ migration after 48 hrs.
Abbreviations: mAb, monoclonal antibody; TECs, tumor epithelial cells.
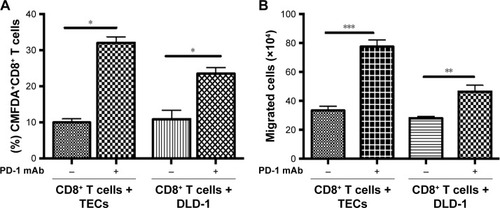
Figure S1 Information on primary tumor.
Notes: (A) PD-L1 staining on 5 μM tumor sections utilized for TECs’ isolation. (B) MHC-I/II staining of isolated TECs shown by flow cytometry, and (C) apoptotic effect of CD8+ T cells on TECs (MSS).
Abbreviations: TECs, tumor epithelial cells; Pt, patient; MSS, MMR proficient; MMR, mismatch repair.
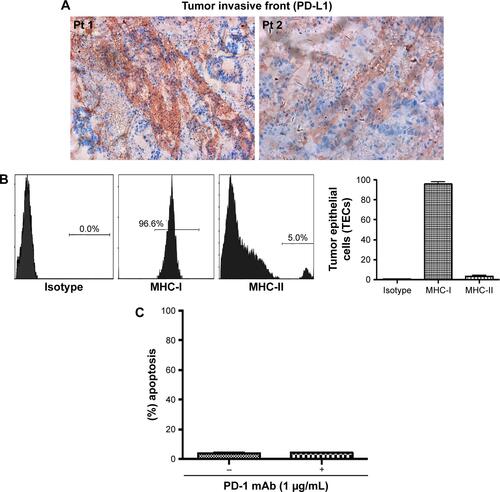
Figure S2 The representative dot plot of flow cytometry staining of tumor antigens, and average level on TECs, DLD-1, SW480, and SW620 along with K562 as a negative control (n=3).
Note: (A) Extracellular EpCAM, (B) intracellular CK20, and (C) intracellular PD-L1.
Abbreviations: TECs, tumor epithelial cells; CK20, cytokeratin 20; SS lin, side scatter linear; FS lin, forward scatter linear.
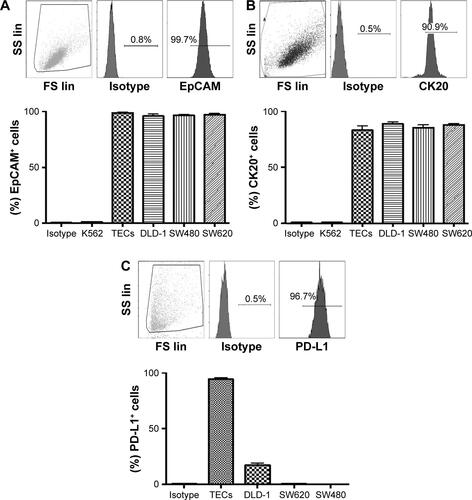
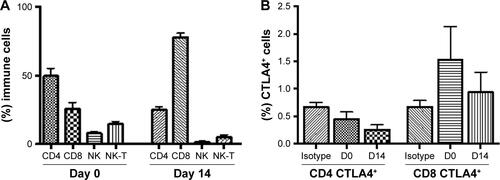
Figure S3 Percentages of (A) killer immune cells, and (B) intracellular CTLA4 before and after ex vivo T cell expansion by flow cytometry (n=11).