
Figures & data
Table 1 Primers sequence for reverse transcription polymerase chain reaction
Figure 1 Effect of anti-PD-L1 antibody in an orthotopic pancreatic cancer mouse model.
Abbreviation: PD-L1, programmed death-ligand 1.
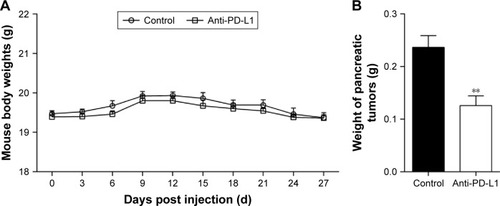
Figure 2 Immunohistochemical analysis of PD-L1 expression in pancreatic cancer tissue and spontaneous liver metastases.
Abbreviation: PD-L1, programmed death-ligand 1.
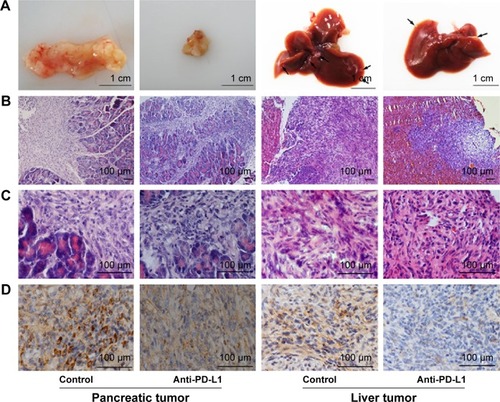
Figure 3 Effect of anti-PD-L1 antibody on expression of mRNA for components involved in the PI3K/Akt/mTOR pathway.
Abbreviations: PD-L1, programmed death-ligand 1; PTEN, phosphatase and tensin homologue; PI3K, phosphatidylinositol 3-kinase; mTOR, mammalian target of rapamycin; RT-PCR, Reverse transcription polymerase chain reaction.
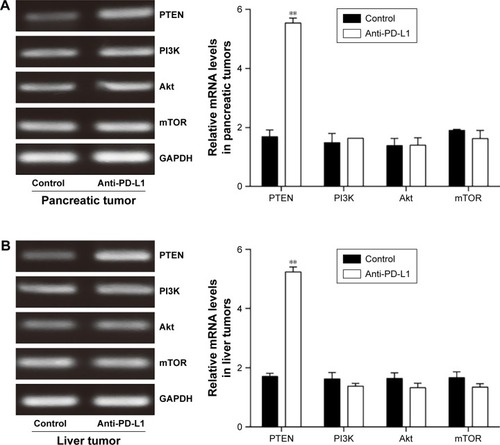
Figure 4 Effect of anti-PD-L1 antibody on proteins involved in the PI3K/Akt/mTOR pathway.
Abbreviations: PD-L1, programmed death-ligand 1; PTEN, phosphatase and tensin homologue; p-Akt, phospho-Akt; PI3K, phosphatidylinositol 3-kinase; mTOR, mammalian target of rapamycin.
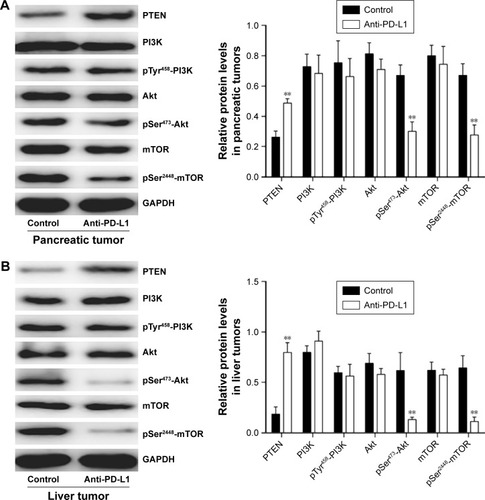
Figure 5 Inhibitory effects of anti-PD-L1 antibody on the invasion behavior of pancreatic tumor and spontaneous liver metastasis.
Abbreviations: MMP2, Matrix metalloproteinases-2; MMP9, Matrix metalloproteinases-9; PD-L1, programmed death-ligand 1; RT-PCR, reverse transcription polymerase chain reaction.
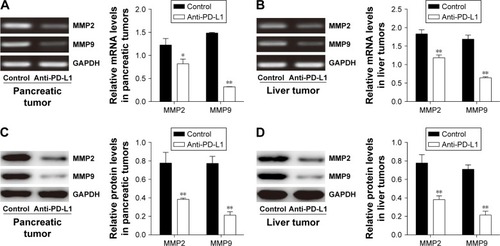
Figure S1 Immunohistochemical score of PD-L1 expression in pancreatic tumor and spontaneous liver metastases.
Notes: (A–D) Images represent pancreatic tumors with IHC scores. (E–H) Images represent liver tumors with IHC scores. Scores are reported as follows: 0 (A, E) represents no staining, 1+(B, F) represents weak staining, 2+(C, G) represents moderate staining, and 3+(D, H) represents intense stainin. Images of A–H are ×400 magnification.
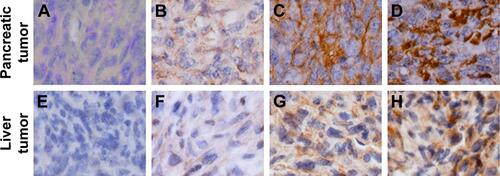
Figure S2 ELISA analysis for the concentration of CA19-9 in serum after PANC 02 cells injection.
Notes: The CA19-9 concentrations in serum after PANC 02 cells injection for 7 days differed significantly from that of the normal level. Data represent the mean ± standard deviation (n=5). **P<0.01.
Abbreviations: CA19-9, carbohydrate antigen 19-9; PANC 02, pancreatic adeno-carcinoma cell line.
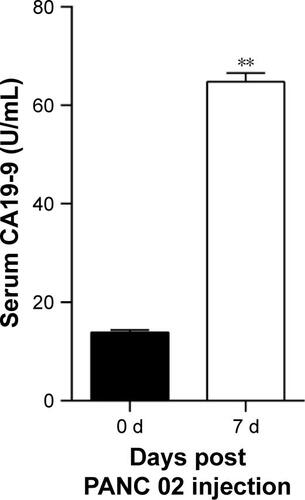
Figure S3 The mRNA expression of IFN-γ, granzyme B, and perforin in pancreatic tumor.
Notes: The expressions of IFN-γ, granzyme B, and perforin were significantly higher in the anti-PD-L1 group than in the controls. Data represent the mean ± standard deviation (n=5). **P<0.01.
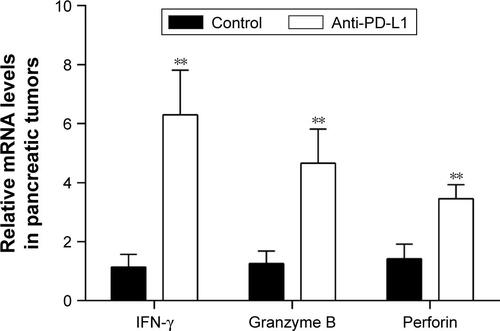
Table S1 Primers sequence for reverse transcription polymerase chain reaction
Table S2 Results of mean H score from three independent pathologists