Figures & data
Figure 1 TGF-β1 induces EMT in EC-1 cells.
Notes: (A) Changes in cell morphology: compared with the cells incubated for 0 h (control), EC-1 cells treated for 24 h or 48 h displayed morphological changes typical for EMT, as demonstrated by the phenotypic transformation from the endothelial cobblestone shape to fibroblastic spindle-shaped morphology. (B) MMP-9, E-cadherin, and vimentin mRNA levels at 0 h, 24 h, and 48 h of incubation: the expression of E-cadherin was downregulated, while the levels of MMP-9 and vimentin were upregulated in EC-1 cells treated with TGF-β1, in comparison with those at 0 h (control). (C) E-cadherin and vimentin immunofluorescence analysis in EC-1 cells treated with TGF-β1. (D) Western blot analysis of MMP-9, E-cadherin, and vimentin levels: the protein expression of E-cadherin was reduced, while the expressions of MMP-9 and vimentin were increased in EC-1 cells treated with TGF-β1, in comparison with those at 0 h (control). β-Actin was used as an internal control. Scale bar: 50 µm. Original magnification, ×200. The data in (B and D) represent mean ± SD of the results obtained in three independent experiments. *P<0.05, **P<0.01, compared with the controls.
Abbreviations: TGF, transforming growth factor; EMT, epithelial–mesenchymal transition; mRNA, messenger RNA; MMP, matrix metalloproteinase; SD, standard deviation.
Abbreviations: TGF, transforming growth factor; EMT, epithelial–mesenchymal transition; mRNA, messenger RNA; MMP, matrix metalloproteinase; SD, standard deviation.
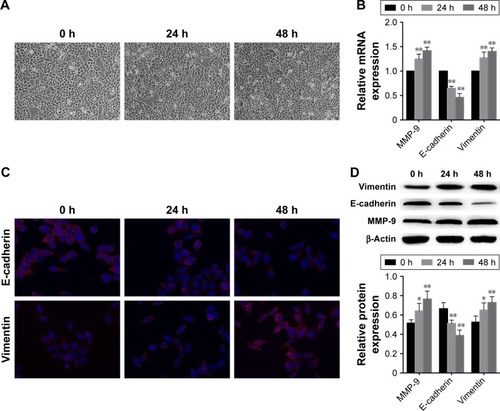
Figure 2 MMP inhibitor GM6001 inhibits TGF-β1-induced EMT.
Notes: (A) Changes in cell morphology: after the exposure to TGF-β1, EC-1 cells displayed morphological changes typical for EMT; GM6001 partially reversed this. (B) E-cadherin and vimentin mRNA levels: the expression of E-cadherin was upregulated and the expression of vimentin was downregulated in EC-1 cells treated with GM6001, in comparison with those in the TGF-β1-treated cells. (C) Immunofluorescence analysis of E-cadherin and vimentin expression in the treated cells and controls (Ctr). (D) Western blot analysis of E-cadherin and vimentin expression: the expression of E-cadherin was upregulated and the expression of vimentin was downregulated in EC-1 cells treated with GM6001, in comparison with those in the TGF-β1-treated cells. β-Actin was used as an internal control. Scale bar: 50µm. Original magnification, ×200. The data in (B and D) represent mean ± SD obtained in three independent experiments. *P<0.05, **P<0.01.
Abbreviations: MMP, matrix metalloproteinase; TGF, transforming growth factor; EMT, epithelial–mesenchymal transition; mRNA, messenger RNA; SD, standard deviation.
Abbreviations: MMP, matrix metalloproteinase; TGF, transforming growth factor; EMT, epithelial–mesenchymal transition; mRNA, messenger RNA; SD, standard deviation.
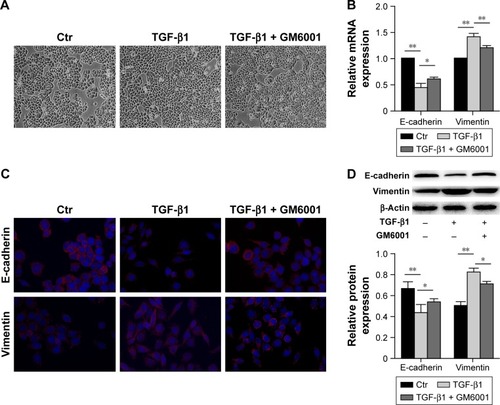
Figure 3 MMP-9 mediates TGF-β1-induced EMT in ESCC.
Notes: (A) MMP-9 activity, determined in EC-1 cells treated for 48 h with medium, TGF-β1, GM6001, or the combination of TGF-β1 and GM6001. (B) MMP-9, E-cadherin, and vimentin expression in MMP-9 knockdown cells, in the presence or absence of TGF-β1. (C and D) MMP-9, E-cadherin, and vimentin protein expression in EC-1 cells transfected with MMP-9 shRNA in the presence or absence of TGF-β1. β-Actin was used as an internal control. The data in (B and D) represent mean ± SD of three independent experiments. *P<0.05, **P<0.01.
Abbreviations: MMP, matrix metalloproteinase; TGF, transforming growth factor; EMT, epithelial–mesenchymal transition; ESCC, esophageal squamous cell carcinoma; shRNA, short hairpin RNA; SD, standard deviation; mRNA, messenger RNA.
Abbreviations: MMP, matrix metalloproteinase; TGF, transforming growth factor; EMT, epithelial–mesenchymal transition; ESCC, esophageal squamous cell carcinoma; shRNA, short hairpin RNA; SD, standard deviation; mRNA, messenger RNA.
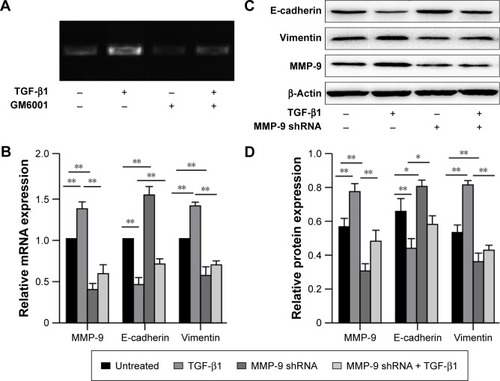
Figure 4 MMP-9 knockdown inhibits invasive and metastatic potential of EC-1 cells and blocks TGF-β1-induced cell invasion and metastasis.
Notes: (A) Representative images of cell invasion assay, showing cells migrating through the Matrigel-coated membranes. (B) Analysis of cell invasion assay results. (C) Representative images of cell scratch assay. (D) Analysis of scratch assay results. Scale bar: 50 µm. Original magnification, ×200. The data in (B and D) represent mean ± SD of the results obtained in three independent experiments. *P<0.05, **P<0.01.
Abbreviations: MMP, matrix metalloproteinase; TGF, transforming growth factor; SD, standard deviation; shRNA, short hairpin RNA.
Abbreviations: MMP, matrix metalloproteinase; TGF, transforming growth factor; SD, standard deviation; shRNA, short hairpin RNA.
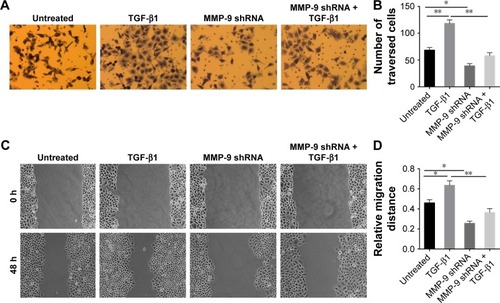
Figure 5 Upregulation of MMP-9 expression induces EMT.
Notes: (A) Representative images of changes in cell morphology, consistent with the induction of EMT. (B) Analysis of E-cadherin and vimentin levels in cells treated with rMMP-9 and controls. (C) Representative images of E-cadherin and vimentin immunofluorescence analysis, in cells treated with rMMP-9 and controls. (D) Western blot analysis of E-cadherin and vimentin expression. β-Actin was used as an internal control. Scale bar: 50 µm. Original magnification, ×200. The data in (B and D) represent mean ± SD of the results obtained in three independent experiments. **P<0.01, compared with the controls.
Abbreviations: MMP, matrix metalloproteinase; EMT, epithelial–mesenchymal transition; rMMP-9, recombinant MMP-9; SD, standard deviation; Ctr, control; mRNA, messenger RNA.
Abbreviations: MMP, matrix metalloproteinase; EMT, epithelial–mesenchymal transition; rMMP-9, recombinant MMP-9; SD, standard deviation; Ctr, control; mRNA, messenger RNA.
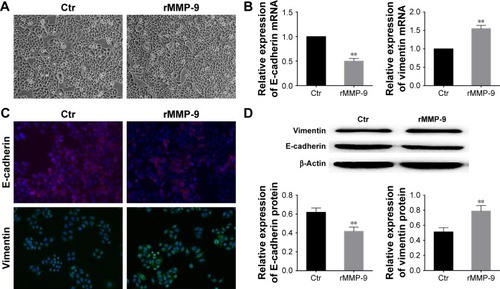
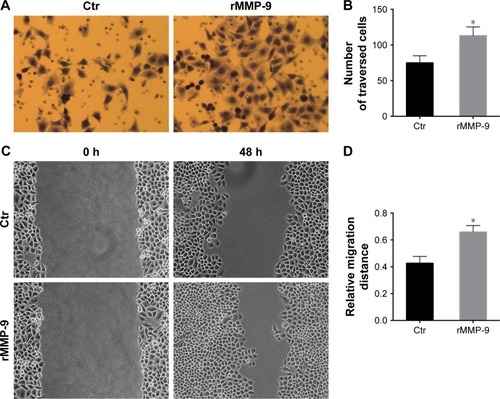
Figure 6 Upregulation of MMP-9 expression enhances EC-1 invasiveness and metastatic potential.
Notes: EC-1 cells were untreated or treated with rMMP-9. (A) Representative images of cells invading through Matrigel-coated membranes. (B) Analysis of the invasion assay results. (C) Representative images, showing the migration of EC-1 cells. (D) Analysis of scratch assay results. Scale bar: 50 µm. Original magnification, ×200. The data in (B and D) represent mean ± SD of the results obtained in three independent experiments. *P<0.05 compared with the controls.
Abbreviations: MMP, matrix metalloproteinase; rMMP-9, recombinant MMP-9; SD, standard deviation; Ctr, control.
Abbreviations: MMP, matrix metalloproteinase; rMMP-9, recombinant MMP-9; SD, standard deviation; Ctr, control.