Figures & data
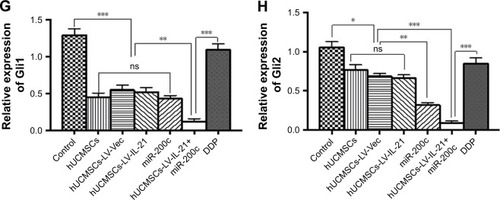
Figure 1 Analysis of the migration ability of SKOV3 cells treated with the different agents. (A) The migration ability of cells treated with the different agents detected by the wound healing assay. (B) The difference of cell healing degree percentage was statistically analyzed on 0 h, 24 h, and 72 h, respectively. *p < 0.05; **p < 0.01; ***p < 0.005.
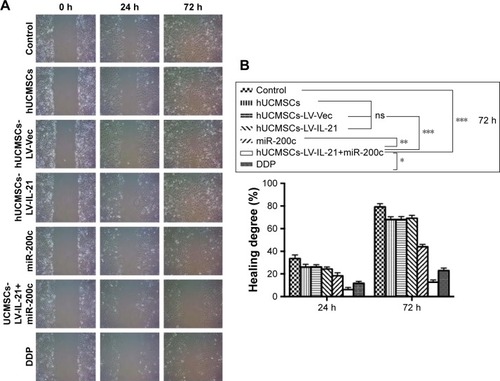
Figure 2 Analysis of the invasion ability of SKOV3 cells treated with the different agents. (A) The invasion ability of cells treated with the different agents was detected by the Transwell assay. (B) The difference of invasive cells per field was statistically analyzed on 24 h. *p < 0.05; **p < 0.01; ***p < 0.005.
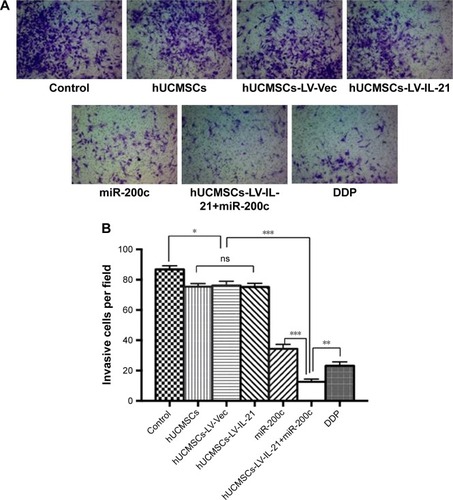
Figure 3 Combination therapy inhibits SKOV3 EOC growth in xenografted mice. The figure shows the quantification analysis of tumor volumes dynamically from the mice after they were initially injected s.c. with 5×10⁶ SKOV3 cells followed by the treatment with a hUCMSCs-LV-IL-21+miR-200c, hUCMSCs-LV-IL-21, hUCMSCs, hUCMSCs-LV-Vec, miR-200c agomir, cisplatin (DDP), PBS, respectively. *p < 0.05 and **p < 0.03.
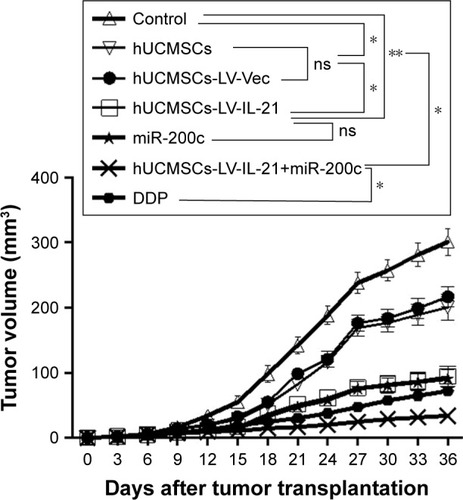
Figure 4 Treatment-associated responses of the splenocytes to target cells. (A) The splenocyte cytotoxicity (target cells: SKOV3, top) and NK cytotoxicity (target cells: YAC-1, bottom) were respectively analyzed by flow cytometry in the xenografted mice 35 days after the mice were initially injected s.c. with 5×10⁶ SKOV3 cells followed by the treatment with various agents as described in the “Materials and methods” section. (B) Statistical analysis results of the splenocyte and NK cytotoxicities. (C and D) Quantification analysis of transcript expression of MIC A and NKG2D by qPCR. *p < 0.05, **p < 0.03, and ***p < 0.003.
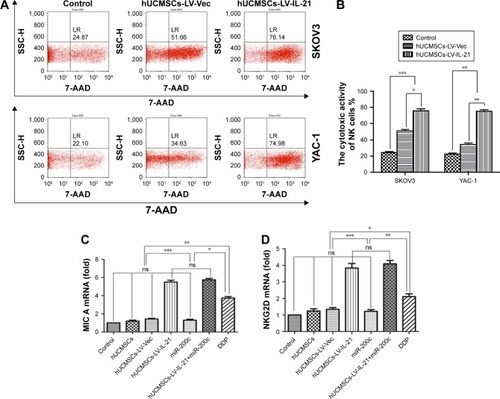
Figure 5 Serum levels of IFN-γ, IL-21, and TNF-α detected by ELISA. (A) Serum level of IFN-γ in the different groups. (B) Serum level of TNF-α in the different groups. (C) Serum level of IL-21 in the different groups. Data are represented as mean ± SEM (n = 6). *p < 0.05 and **p < 0.03.
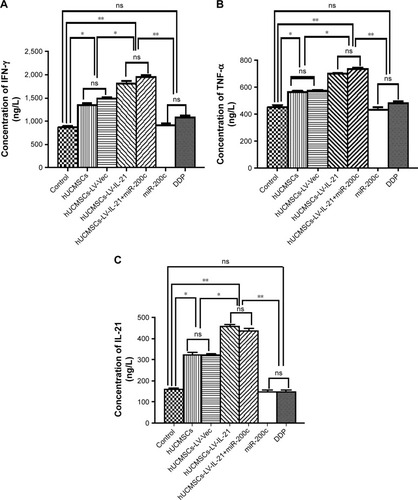
Figure 6 IHC analysis of Wnt/β-catenin signal pathway and EMT related-molecule expression in SKOV3 EOC tissues.
Notes: (1–3A, 1–3B) Images of Wnt/β-catenin signaling and EMT related-molecule expression of β-catenin, cyclin-D1, Gli1, Gli2, ZEB1, and E-cadherin in the tumor tissues analyzed with IHC (original magnification, ×400). (1–3C, 1–3D) The quantification analysis of the molecular expression. The brown color spots show the positive cells observed under a light microscopy. *p < 0.05, **p < 0.03, and ***p < 0.003.
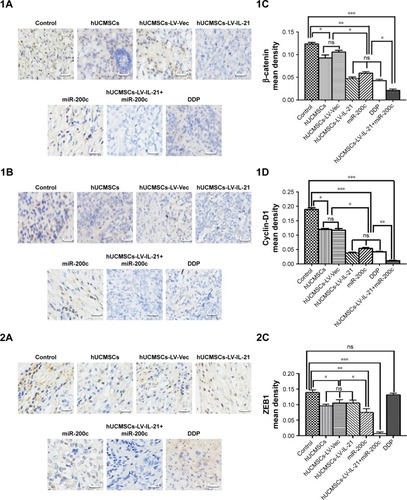
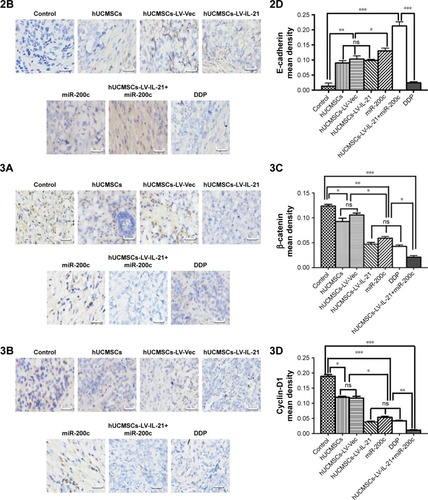
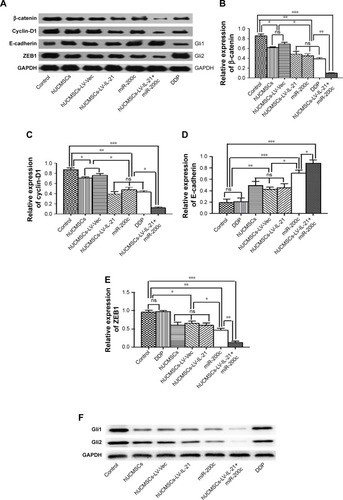
Figure 7 Western blot analysis of Wnt/β-catenin signal pathway and EMT related-molecule expression in SKOV3 EOC tissues. (A and F) The representative images of bands of the Wnt/β-catenin signaling and EMT related-molecule expression. (B–E and G–H) The semi-quantification analysis of the molecular expression. *p < 0.05, **p < 0.03, and ***p < 0.003.