Figures & data
Figure 1 Effect of ethyl acetate extract of N. ventricosa x sibuyanensis (EANS) on viability of oral cancer and normal oral cells. (A) Viabilities of EANS-treated cells. Oral cancer cells (CAL 27, Ca9-22, and SCC9) and oral normal cells (HGF-1) were treated with 0 (untreated control), 20, 30, and 40 μg/mL of EANS for 24 hrs. p<0.01~0.0001. (B) Viabilities of N-acetylcysteine (NAC)-pretreated and EANS-treated cells. Cells were pretreated with or without NAC (2 mM, 1 hr) and posttreated with EANS (30 μg/mL, 24 hrs), ie, NAC+EANS vs EANS. p<0.05~0.0001. (C) Viabilities of pan-caspase inhibitor Z-VAD-FMK (Z-VAD)-pretreated and EANS-treated Ca9-22 cells. Cells were pretreated with Z-VAD (20 μM, 2 hrs) and posttreated with EANS (30 μg/mL, 24 hrs), ie, Z-VAD+EANS. p<0.01~0.0001. Different treatments of the same cell lines were compared with each other. Treatments without the same labels (a–d) indicate the significant difference. From the example of Figure 1C, control (A) is differed significantly to EANS (C) and Z-VAD+EANS (B) in Ca9-22 cells, ie, “a” without the same small letters to “c” or “b”. Similarly, Z-VAD (A) is differed significantly to Z-VAD+EANS (B) without the same small letters. In contrast, control (A) is nonsignificant to Z-VAD (A) because they have the same letter “a”. Data, mean ± SD (n=3).
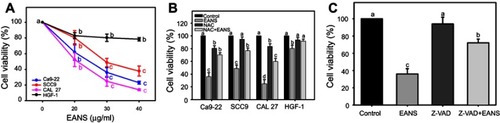
Figure 2 Effect of ethyl acetate extract of N. ventricosa x sibuyanensis (EANS) on cell cycle distributions of oral cancer cells. (A) DNA histograms of different concentrations of EANS treatments in oral cancer cells. Ca9-22 cells were pretreated with or without N-acetylcysteine (NAC) (2 mM, 1 hr) and posttreated with EANS for 24 hrs (0 (untreated control), 20, 30, and 40 μg/mL, namely EANS 20, 30, and 40), ie, NAC+EANS vs EANS. (B) Statistics of cell cycle distribution in Figure 2A. Different treatments of the same cell cycle phases were compared with each other. Treatments without the same labels (a to c) indicate the significant difference. For the example of G1 population, control (ab) is differed significantly to EANS 20 (C) in Ca9-22 cells, ie, “ab” without the same small letters to “c”. In contrast, control (ab) is nonsignificant to NAC (A) or NAC+EANS 20 (B) because they have the same letter “a” or “b”. p<0.05~0.0001. Data, mean ± SD (n=3).
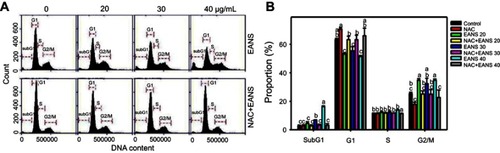
Figure 3 Effect of ethyl acetate extract of N. ventricosa x sibuyanensis (EANS) on annexin V-based apoptosis of oral cancer cells. (A) Annexin V/7AAD dot-plot graphs of different concentrations of EANS treatments in oral cancer cells. Ca9-22 cells were pretreated with or without N-acetylcysteine (NAC) (2 mM, 1 hr) and posttreated with EANS (0 (untreated control), 20, 30, and 40 μg/mL, 24 hrs), ie, NAC+EANS vs EANS. Populations of annexin V (+)/7AAD (+) and annexin V (+)/7AAD (–) were classified to apoptosis. (B) Statistics of apoptosis change in Figure 3A. Different treatments were compared with each other. Treatments without the same labels (a–d) indicate the significant difference. p<0.05~0.0001. (C) Annexin V/7AAD dot-plot graphs of time course of EANS treatments in oral cancer cells. Ca9-22 cells were pretreated with or without NAC and posttreated with EANS (40 μg/mL, 0, 12, and 24 hrs). (D) Statistics of apoptosis change in Figure 3C. Treatments without the same labels (a to c) indicate the significant difference. p<0.05~0.0001. Data, mean ± SD (n=3).
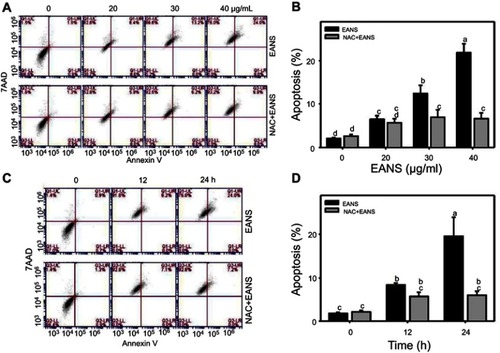
Figure 4 Effect of ethyl acetate extract of N. ventricosa x sibuyanensis (EANS) on caspases-based apoptosis of oral cancer cells. (A) Pancaspase graphs of different concentrations of EANS treatments in oral cancer cells. Ca9-22 cells were pretreated with or without N-acetylcysteine (NAC) (2 mM, 1 hr) and posttreated with EANS (0 (untreated control), 20, 30, and 40 μg/mL, 24 hrs), ie, NAC+EANS vs EANS. Pancaspase-positive population is marked as Pan (+). (B) Statistics of apoptosis change in Figure 4A. Different treatments were compared with each other. Treatments without the same labels (a–e) indicate the significant difference. p<0.05~0.0001. (C) Pancaspase graphs of time course of EANS treatments in oral cancer cells. Ca9-22 cells were pretreated with or without NAC and posttreated with EANS (40 μg/mL, 0, 12, and 24 hrs). (D) Statistics of apoptosis change in Figure 4C. Treatments without the same labels (a–c) indicate the significant difference. p<0.05~0.0001. Data, mean ± SD (n=3). (E) Western blotting for apoptosis signaling protein expressions. Ca9-22 cells were pretreated with or without NAC and posttreated with EANS (40 μg/mL, 0, 12, and 24 hrs). Cleaved forms of caspase 3, caspase 8, and caspase 9 are abbreviated as c-cas 3, c-cas 9, and c-cas 8.
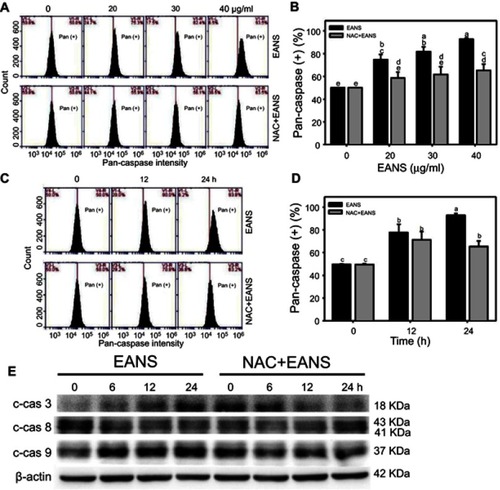
Figure 5 Effect of ethyl acetate extract of N. ventricosa x sibuyanensis (EANS) on reactive oxygen species (ROS) generation of oral cancer cells. (A) ROS graphs of different concentrations of EANS treatments in oral cancer cells. Ca9-22 cells were pretreated with or without N-acetylcysteine (NAC) (2 mM, 1 hr) and posttreated with EANS (0 (untreated control), 20, 30, and 40 μg/mL, 3 hrs), ie, NAC+EANS vs EANS. ROS-positive population is marked as ROS (+). (B) Statistics of ROS change in Figure 5A. Different treatments were compared with each other. Treatments without the same labels (a–e) indicate the significant difference. p<0.05~0.0001. (C) ROS graphs of time course of EANS treatments in oral cancer and normal oral cells. Oral cancer cells (Ca9-22) and normal oral cells (HGF-1) were pretreated with or without NAC and posttreated with EANS (40 μg/mL, 0, 15, 30, 60, 120, and 180 mins). (D) Statistics of ROS change in Figure 5C. Treatments without the same labels (a–e) indicate the significant difference. p<0.05~0.0001. Data, mean ± SD (n=3).
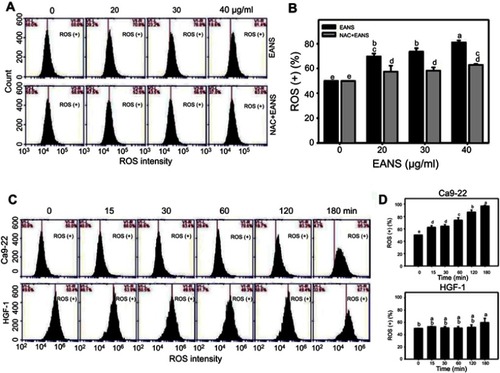
Figure 6 Effect of ethyl acetate extract of N. ventricosa x sibuyanensis (EANS) on mitochondrial superoxide (MitoSOX) generation of oral cancer cells. (A) MitoSOX graphs of different concentrations of EANS treatments in oral cancer cells. Ca9-22 cells were pretreated with or without N-acetylcysteine (NAC) (2 mM, 1 hr) and posttreated with EANS (0 (untreated control), 20, 30, and 40 μg/mL, 24 hrs), ie, NAC+EANS vs EANS. MitoSOX-positive population is marked as MitoSOX (+). (B) Statistics of MitoSOX change in Figure 6A. Different treatments were compared with each other. Treatments without the same labels (a–f) indicate the significant difference. p<0.05~0.0001. (C) MitoSOX graphs of time course of EANS treatments in oral cancer cells. Ca9-22 cells were pretreated with or without NAC and posttreated with EANS (40 μg/mL, 0, 12, and 24 hrs). (D) Statistics of MitoSOX change in Figure 6C. Treatments without the same labels (a–c) indicate the significant difference. p<0.001~0.0001. Data, mean ± SD (n=3).
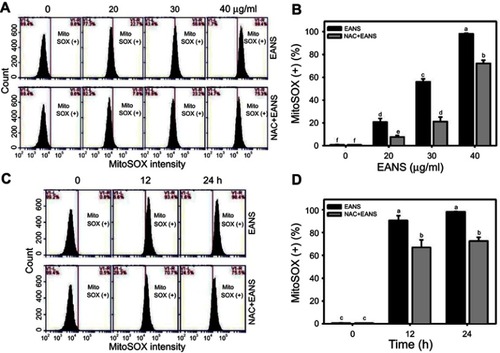
Figure 7 Effect of ethyl acetate extract of N. ventricosa x sibuyanensis (EANS) on mitochondrial membrane potential (MMP) of oral cancer cells. (A) MMP graphs of different concentrations of EANS treatments in oral cancer cells. Ca9-22 cells were pretreated with or without mitochondrial superoxide inhibitor (Mito TEMPO) (20 µM, 1 hr) and posttreated with EANS (0 (untreated control), 20, 30, and 40 μg/mL, 24 hrs), ie, Mito TEMPO+EANS vs EANS. MMP-negative population is marked as MMP (–). (B) Statistics of MMP change in Figure 7A. Different treatments were compared with each other. Treatments without the same labels (a–e) indicate the significant difference. p<0.05~0.0001. (C) MMP graphs of time course of EANS treatments in oral cancer cells. Ca9-22 cells were pretreated with or without Mito TEMPO (20 µM, 1 hr) and posttreated with EANS (40 μg/mL, 0, 12, and 24 hrs). (D) Statistics of MMP change in Figure 7C. Treatments without the same labels (a–c) indicate the significant difference. p<0.05~0.0001. Data, mean ± SD (n=3).
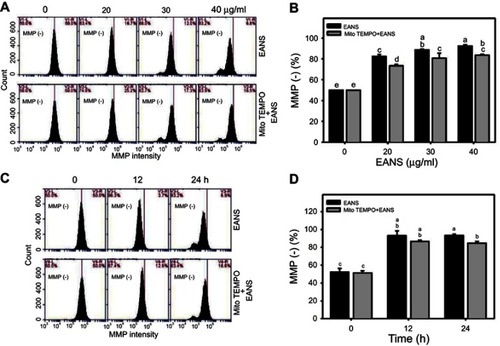
Figure 8 Effect of ethyl acetate extract of N. ventricosa x sibuyanensis (EANS) on γH2AX-based DNA damage of oral cancer cells. (A) γH2AX graphs of different concentrations of EANS treatments in oral cancer cells. Ca9-22 cells were pretreated with or without N-acetylcysteine (NAC) (2 mM, 1 hr) and posttreated with EANS (0 (untreated control), 20, 30, and 40 μg/mL, 24 hrs), ie, NAC+EANS vs EANS. γH2AX-positive population is marked as γH2AX (+). (B) Statistics of γH2AX change in Figure 8A. Different treatments were compared with each other. Treatments without the same labels (a–e) indicate the significant difference. p<0.05~0.0001. (C) γH2AX graphs of time course of EANS treatments in oral cancer cells. Ca9-22 cells were pretreated with or without NAC and posttreated with EANS (40 μg/mL, 0, 12, and 24 hrs). (D) Statistics of γH2AX change in Figure 8C. Treatments without the same labels (a–d) indicate the significant difference. p<0.05~0.0001 . Data, mean ± SD (n=3).
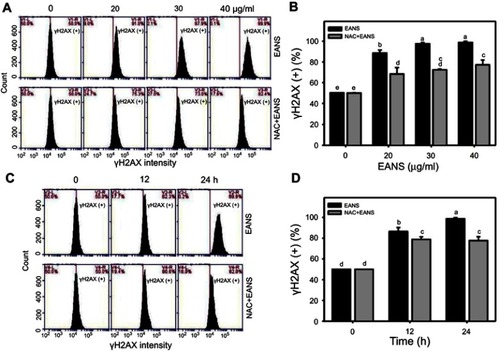
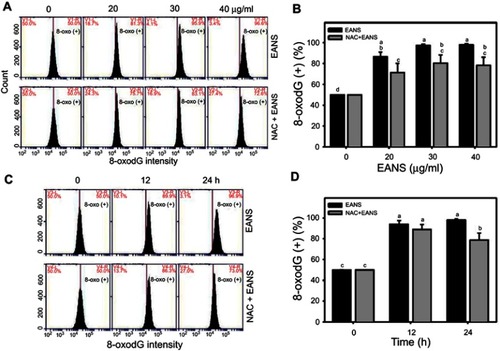
Figure 9 Effect of ethyl acetate extract of N. ventricosa x sibuyanensis (EANS) on 8-oxo-2ʹ-deoxyguanosine (8-oxodG)-based DNA damage of oral cancer cells. (A) 8-oxodG graphs of different concentrations of EANS treatments in oral cancer cells. Ca9-22 cells were pretreated with or without N-acetylcysteine (NAC) (2 mM, 1 hr) and posttreated with EANS (0 (untreated control), 20, 30, and 40 μg/mL, 24 hrs), ie, NAC+EANS vs EANS. 8-oxodG-positive population is marked as 8-oxodG (+). (B) Statistics of 8-oxodG change in Figure 9A. Different treatments were compared with each other. Treatments without the same labels (a–d) indicate the significant difference. p<0.05~0.0001. (C) 8-oxodG graphs of time course of EANS treatments in oral cancer cells. Ca9-22 cells were pretreated with or without NAC and posttreated with EANS (40 μg/mL, 0, 12, and 24 hrs). (D) Statistics of 8-oxodG change in Figure 9C. Treatments without the same labels (a–c) indicate the significant difference. p<0.05~0.0001. Data, mean ± SD (n=3).