Figures & data
Figure 1 miR-509-5p is decreased and reversely correlated with PCNA expression in germ cells from infertile men with maturation arrest. (A-B) miR-509-5p level (A) and PCNA level (B) in the testes of normal controls (NC, n = 8) and infertile men with maturation arrest (MA, n = 12) were determined by qRT-PCR analysis. U6 snRNA and β-actin were used as internal controls, respectively. Each symbol represents the mean value from 3 replicates. P values are shown above. (C) The correlation of miR-509-5p level and PCNA level shown as in (A-B) was analyzed by the Pearson’s correlation analysis. r = −0.7139; P = 0.0004; n = 20.
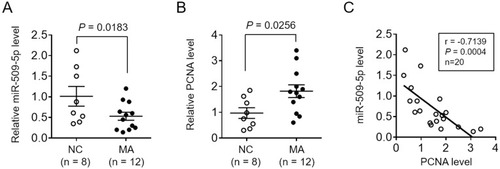
Figure 2 miR-509-5p inhibits proliferation and induces apoptosis of testicular germ cell tumor cells. (A-C) TGCT cell lines NT2 and NCCIT were transfected with negative control mimic (NC mimic) or 100 nM miR-509-5p mimic. After 3 days, cells were harvested for following analyses. (A) miR-509-5p level was determined by qRT-PCR analysis (n = 3). U6 snRNA level was used as an internal control. (B) Cell proliferation was assessed using CCK-8 assay (n = 5). (C) Cell apoptosis was analyzed by FACS (n = 5). (D) NT2 and NCCIT were transfected with NC mimic, 50 mM or 100 nM miR-509-5p mimic. After 3 days, the cleaved caspases 3 was detected by Western blotting. (E-H) NT2 and NCCIT were transfected with negative control inhibitor (NC inhibitor) or miR-509-5p inhibitor. After 3 days, the miR-509-5p level (E), cell proliferation (F), and cell apoptosis (G-H) were analyzed as in (A-D). Data are mean ± SD. **P < 0.01.
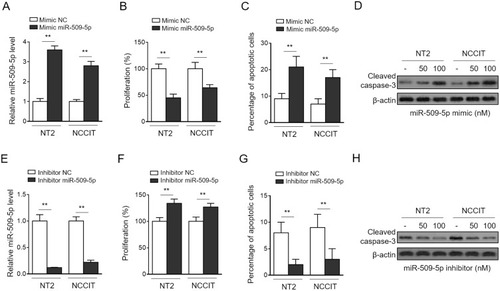
Figure 3 miR-509-5p targets MDM2. (A, upper panel) The putative binding sites for miR-509-5p in MDM2 3ʹ-UTR was predicted by TargetScan algorithms. (A, bottom panel) NC mimic or miR-509-5p mimic was cotransfected with luciferase reporter construct with either wild-type (wt-MDM2) or mutant MDM2 3ʹ-UTR (mut-MDM2) into HEK293 cells. The luciferase activity assayed at 36 h after transfection (n = 5). (B-D) NT2 and NCCIT were transfected with NC mimic or miR-509-5p mimic, or NC inhibitor or miR-509-5p inhibitor. The mRNA level (B-C) and protein level (D) of MDM2 were determined by qRT-PCR analysis and Western blotting analysis, respectively. (E-F) The mRNA level (E) and protein level (F) of MDM2 in the testes of normal controls (NC, n = 8) and infertile men with maturation arrest (MA, n = 12) were determined. Data are mean ± SD. **P < 0.01; NS, not significant.
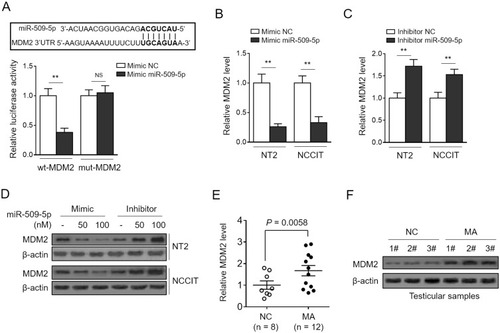
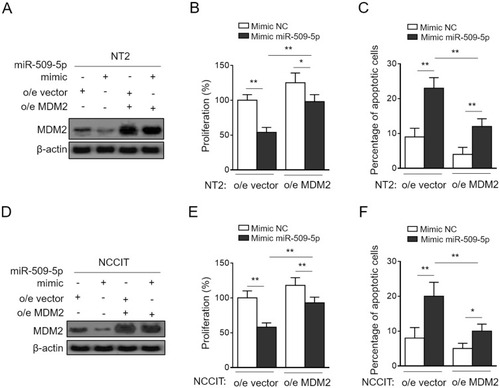
Figure 4 MDM2 restoration rescues miR-509-5p effects on testicular germ cell tumor cells. (A-C) NT2 cells were transfected with NC mimic or 100 nM miR-509-5p mimic in combination with pcDNA3.1-vector or pcDNA3.1-MDM2. (A) The protein level of MDM2 was determined by Western blotting analysis. (B) Cell proliferation was determined by CCK-8 method (n = 5). (C) Cell apoptosis was assessed by FACS analysis (n = 5). (D-F) NCCIT cells were treated as in (A). The protein level of MDM2 (D), cell proliferation (E), and cell apoptosis (F) were analyzed as in (A-C). Data are mean ± SD. *P < 0.05; **P < 0.01.