Figures & data
Figure 1 Melatonin inhibited the growth and migration ability of tumor cells (A) CCK8 assessment results of AGS and SGC-7901 cell activity following being treated with melatonin for 24, 48, and 72 h at varying concentrations. (B) Scratch assessment results indicated that the cell migration inhibition in the melatonin group. The figure indicates data as the means ± SD, n=3. Student’s t-test was compared to the control, *P<0.05, **P<0.01.
Abbreviations: M1, 1 mM melatonin; M2, 2 mM melatonin; M3, 3 mM melatonin; Con, control trip.
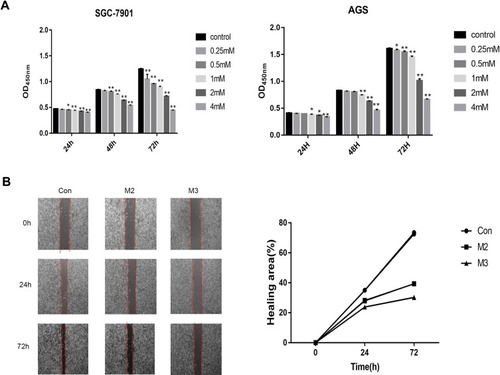
Figure 2 Melatonin inhibited the migration and invasion ability of tumor cells (A, B) Following treatment of AGS cells with increasing doses of melatonin (0, 1, 2, 3 mM) for 48 h ((A) for migration and (B) for invasion), migration and invasion assays were observed (magnification, x200). (C) Quantitative analysis of migration and invasion assays. Data as the means ± SD, n=3. *P<0.05, **P<0.01 compared to the control.
Abbreviations: M1, 1 mM melatonin; M2, 2 mM melatonin; M3, 3 mM melatonin; Con, control trip.
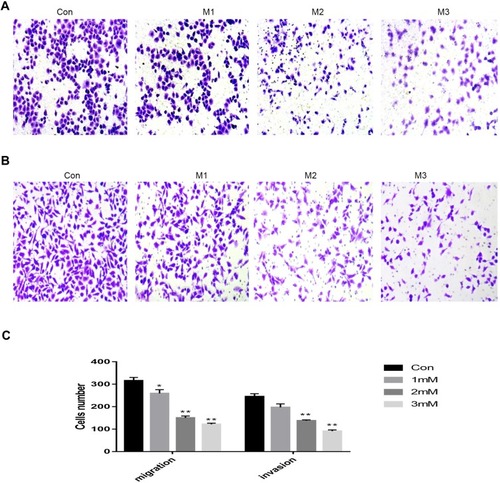
Figure 3 Melatonin- induced cell death of the human gastric cancer cell line AGS. (A) AGS cell apoptosis was specified using flow cytometry following treating with melatonin (0, 1, 2, 3 mM) for 48 h. (B) Western blot results of apoptosis-related proteins Bax and Casepase-3.β-actin and Bcl-2 were utilized as the internal control. (C) Western blot results were measured and provided as the control percent. Data are expressed as mean ± SD. **p < 0.01 compared to control.
Abbreviations: M1, 1 mM melatonin; M2, 2 mM melatonin; M3, 3 mM melatonin; Con, control trip.
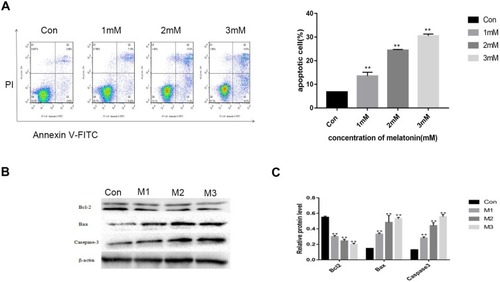
Figure 4 Melatonin increased speed of AGS cell apoptosis and autophagy by ER stress-upregulation. (A) Western blot analysis of the ER stress associated with protein expressions. Following the melatonin treatment, the GRP78 expressions significantly upregulated compared with the control group in a dose-dependent manner. β-actin was utilized for normalization of band density as the loading control. (B) Western blot analysis of ER stress and autophagy related proteins expression following treating with the ER stress inhibitor 4- PBA and autophagy inhibitor 3-MA. (C) Western blot analysis of protein expression following treating with the IRE inhibitor STF 083010. It was found that GRP78, P62, Beclin-1, p-JNK, and LC3II expression was significantly upregulated in comparison with the control group, and, since 2mM melatonin is given, the protein expression was inverted. (D–F) Western blot results were measured and provided as the percent of the control. All tests were performed three times. Here, data are presented as the means ± SD, n=3. Student’s t-test was compared to control. *P<0.05, **P<0.01 compared to the control.
Abbreviations: GRP78, glucose-regulated protein 78; 4-PBA, 4-phenylbutyric acid; 3-MA, 3-Methyladenine; STF, STF-083010; M2, 2 mM melatonin; JNK, c-Jun N-terminal kinase; p-, phosphorylated; Con, control trip.
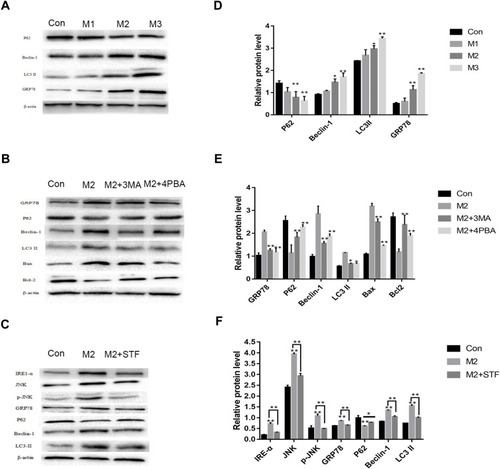
Figure 5 Melatonin activated autophagy by ER stress in GC cells (A, B) AGS cells were immunostained with GRP78 and LC3 antibodies and observed by the microscope (magnification, x400). Data are shown as means ± SEM of at least 3 independent experiments.
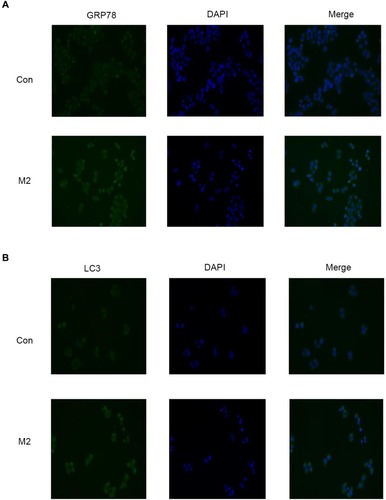
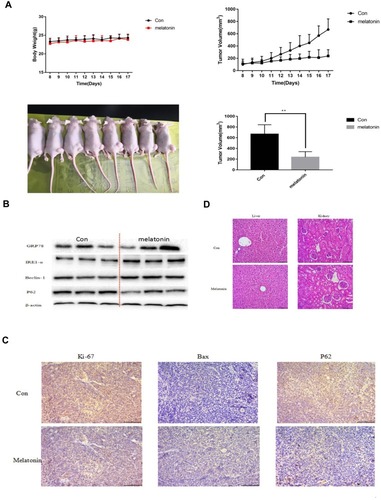
Figure 6 Melatonin prevents GC cells apoptosis, proliferation, and autophagy in vivo. (A) inoculation of 5x10⁶ SGC-7901 cells was done into BALB/c-nude mice. The mice were assigned into two groups (n=6) randomly, and they were treated with melatonin and PBS on a daily basis for 10 days. Measurement of body weight and tumor volumes was done daily. (B) The tumor tissues were cut out, and a Western blot assay was performed. (C) The apoptosis, autophagy and invasion of Bax, P62 and Ki67 in xenograft tumor tissues were determined by immunohistochemistry (magnification, x400). (D) The kidneys and liver from the treatment and control groups were stained by eosin and hematoxylin so that the toxicity can be evaluated following the treatment. The kidney and liver’s histological structures were obtained, and they were compared by the microscope (magnification, x200). **P<0.01 compared to the control.
Abbreviations: PBS, phosphate-buffered saline; Con, control.