Figures & data
Figure 1 ARHGAP4 expression in pancreatic cancer tissues. (A) ARHGAP4 mRNA levels were decreased in pancreatic cancer tissues (n=70) compared with the adjacent-normal tissues (n=70). (B) ARHGAP4 mRNA levels in 70 cases of pancreatic cancer patients (log2 T/N). (C) ARHGAP4 mRNA expression in five pancreatic cancer cell lines, including BxPC-3, Capan-1, PANC-1, MIA PaCa-2 and SW1990. ***P<0.001 compared with adjacent-normal.
Abbreviations: PC, pancreatic cancer; N, adjacent-normal pancreatic tissues; T, pancreatic cancer tissues.
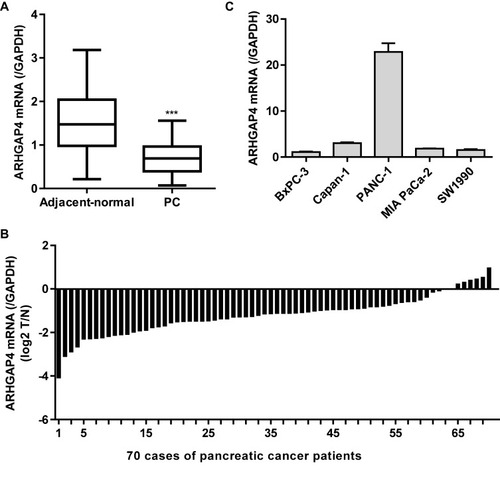
Figure 2 miR-939-5p targeted ARHGAP4 directly at the 3ʹ-UTR of ARHGAP4 in pancreatic cancer cells. (A) The binding sites of miR-3150a-3p, miR-939-5p and miR-762 on the 3ʹ-UTR of ARHGAP4 were predicted by Targetscan. (B) miR-3150a-3p, miR-939-5p and miR-762 levels in BxPC-3 cells transfected with their corresponding inhibitor or negative control (NC). (C) ARHGAP4 mRNA levels in BxPC-3 cells transfected with miR-3150a-3p, miR-939-5p, or miR-762 inhibitor or NC. (D) The luciferase activity was measured by the Dual-Luciferase Reporter Assay. ***P<0.001 compared with NC.
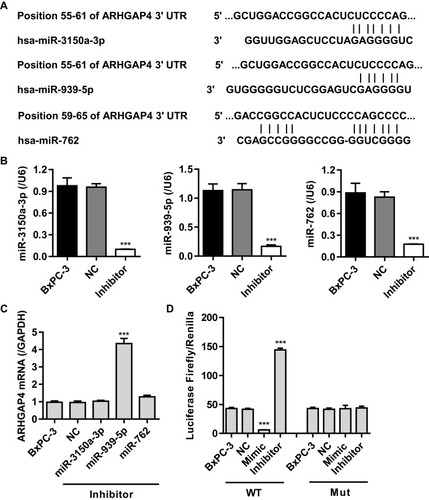
Table 1 Correlation of the Expression of miR-939-5p with Clinicopathological Parameters in Patients with PC
Figure 3 miR-939-5p expression in pancreatic cancer tissues. (A) miR-939-5p level was increased in pancreatic cancer tissues (n=70) compared with the adjacent-normal tissues (n=70). (B) miR-939-5p levels in 70 cases of pancreatic cancer patients (log2 T/N). (C) Pearson correlation scatter plots in pancreatic tissues (n=70). (D) Kaplan-Meier curve of pancreatic patients with high or low miR-939-5p levels analyzed by Log-rank (Mantel-Cox) test. ***P<0.001 compared with adjacent-normal.
Abbreviations: PC, pancreatic cancer; N, adjacent-normal pancreatic tissues; T, pancreatic cancer tissues.
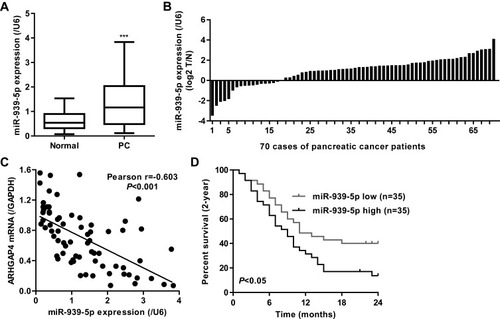
Figure 4 miR-939-5p down-regulation inhibited pancreatic cancer cell invasion and migration. (A) ARHGAP4 mRNA expression in five pancreatic cancer cell lines, including BxPC-3, Capan-1, PANC-1, MIA PaCa-2 and SW1990. After BxPC-3 (B, D) and SW1990 (C, E) cells were transfected with miR-939-5p inhibitor, the cell viability, invasion and migration were decreased than those transfected with negative control (NC). ***P<0.001 compared with NC.
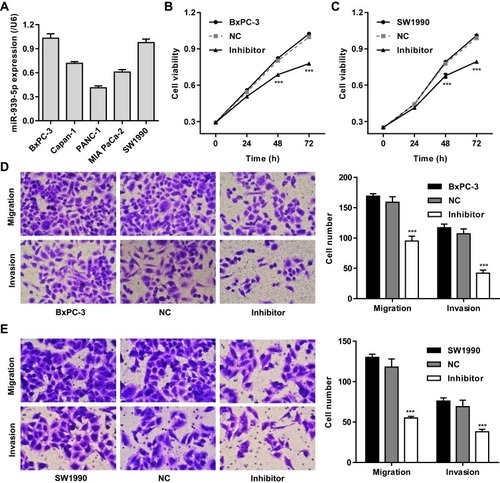
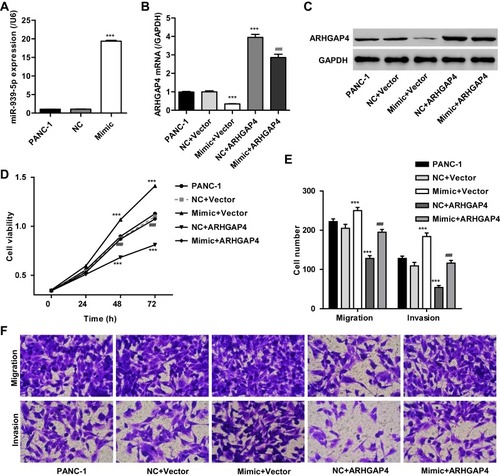
Figure 5 miR-939-5p up-regulation promoted pancreatic cancer cell invasion and migration through targeting ARHGAP4. After PANC-1 cells were transfected with miR-939-5p mimic and/or transduced with lentivirus expressing ARHGAP4, miR-939-5p levels (A), ARHGAP4 mRNA levels (B, C) and cell viability (D), migration, and invasion (E, F) were measured. ***P<0.001 compared with NC+blank lentivirus vector (Vector). ###P<0.001 compared with mimic+Vector.