Figures & data
Figure 1 Omega-3PUFA attenuates MNU-induced CRC in rats. The rats of two groups received an intra-rectal instillation of MNU solution (0.5 mL, 10 mg/kg) three times a week for 4 weeks. Rats in the Omega-3PUFA intervention group were intragastrically given Omega-3PUFA (2 g.kg−1) once a day for 4 weeks (the control groups of rats were given the same amount of normal saline instead of Omega-3PUFA). (A) The body weights of the two groups of rats were measured every three days. (B) The rats were dissected and the number of intestinal tumor tissues was observed and recorded. (Representative micrograph of three individual subjects). (C) The number of colorectal cancer rats and non-cancer rats in the two groups of rats was measured, and the tumor incidence rate was calculated. (D) The pathological morphology of colorectal cancer tissues and non-cancer tissues was detected by HE staining. Representative micrographs from 6 mice per group are shown, magnification: ×200. (E) The average number of tumors in the two groups (Omega-3PUFA group and control group) of rats was measured. (F) The average tumor weight of the two groups (Omega-3PUFA group and control group) of rats was measured. Unpaired 2-tailed t test. *P < 0.05, **P < 0.01. Bar graphs represent the mean ± SD for C, E and F.
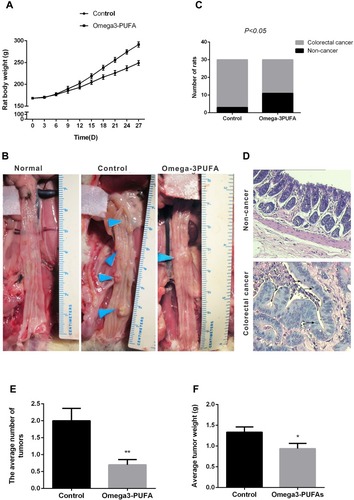
Figure 2 Omega-3 PUFA inhibits AKT/Bcl-2 signaling in MNU-induced colorectal cancer rats. Rats in the Omega-3PUFA intervention group were intragastrically given Omega-3PUFA (2 g.kg−1) once a day for 4 weeks (the control groups of rats were given the same amount of normal saline instead of Omega-3PUFA). (A) The protein levels of p-AKT, Bcl-2 and cleaved caspase3 in the tumor tissues of the two groups (Omega-3PUFA group and control group) were detected by immunohistochemistry. Representative micrographs from 6 mice per group are shown, Scale bar=200 μm. (B-D) Quantitative analysis of protein levels of p-AKT (B), Bcl-2 (C) and cleaved caspase3 (D) in tumor tissues of the two groups. Unpaired 2-tailed t test. **P < 0.01. Bar graphs represent the mean ± SD for B, C and D.
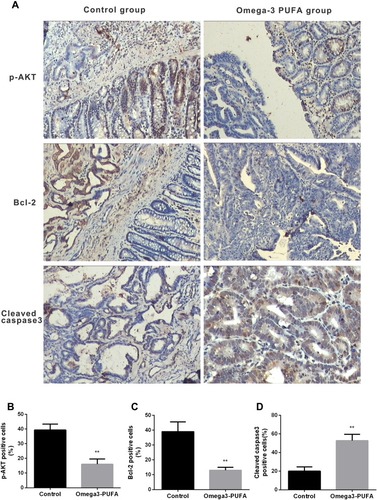
Figure 3 Omega-3PUFA inhibits CRC cell proliferation and induces CRC cell apoptosis. (A, B, C) HCT116, SW480 or RCCC cells were treated with Omega-3PUFA (10, 20, 40 and 80 µg/mL) for 24h. The effect of Omega-3 PUFA on HCT116 (A), SW480 (B) and RCCC (C) cell proliferation was observed by CCK8 analysis. (D, F, H) Cells were treated with Omega-3PUFA (40 µg/mL) for 24 h. The cells were stained with Annexin V-APC and 7-AAD. The apoptosis rate of the HCT116 (D), SW480 (F) and RCCC (H) cells was measured by flow cytometry. (E, G, I) Statistical analysis of apoptosis detection in HCT116 (E), SW480 (G) and RCCC (I) cells. Unpaired 2-tailed t test. *P < 0.05, **P < 0.01. Bar graphs represent the mean ± SEM for A, B, C, E, G and I.
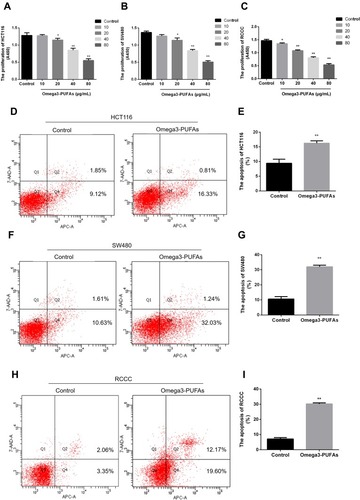
Figure 4 Omega-3 PUFA inhibits CRC cell colony formation and invasion. (A, C, E) HCT116, SW480 or RCCC cells were treated with Omega-3PUFA (40 µg/mL) for 24 h. The number of clones of HCT-116 (A), SW480 (C) and RCCC (E) cells in the Omega-3 PUFA group and control group was detected by plate clone formation assay. (B, D, F) Quantitative analysis of the number of clones of HCT116 (B), SW480 (D) RCCC (F) cells. (G, I, K) HCT116, SW480 or RCCC cells were seeded in transwell chambers and treated with Omega-3 PUFA (40 μg/mL) for 24 hrs. The number of cell invasions is detected. (H, J, L) Quantitative analysis of invasion numbers of HCT116 (H), SW480 (J) and RCCC (L) cells. Unpaired 2-tailed t test. **P < 0.01. Bar graphs represent the mean ± SEM for B, D, F, H, J and L.
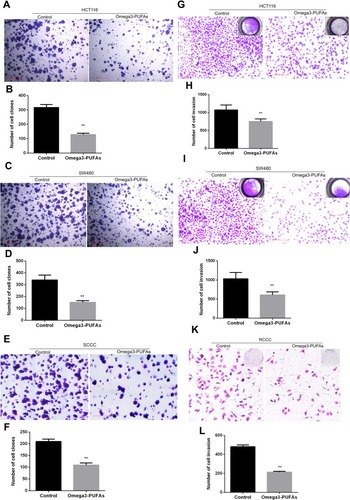
Figure 5 Omega-3PUFA inhibits PI3K/AKT/Bcl-2 signaling in CRC cells. (A, C, E) HCT116, SW480 or RCCC cells were pretreated with 10 μM PI3K activator (740Y-P) for 1h then exposed to Omega-3 PUFA. The protein expression of p-PI3K, PI3K, p-AKT, AKT and Bcl-2 in HCT116 (A), SW480 (C) and RCCC (E) cells was detected by Western blot. (B, D, F) Quantitative analysis of protein expression (p-PI3K, PI3K, p-AKT, AKT and Bcl-2) in HCT116 (B), SW480 (D) and RCCC (F) cells. Unpaired 2-tailed t test. **P < 0.01; ##P < 0.01. Bar graphs represent the mean ± SD for B, D and F.
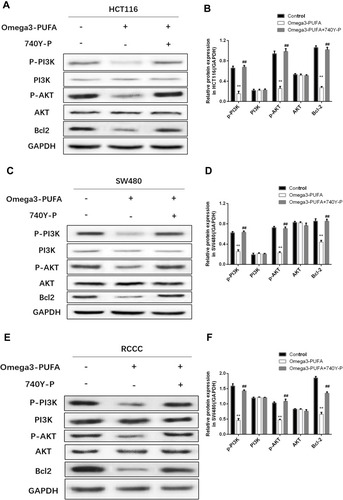
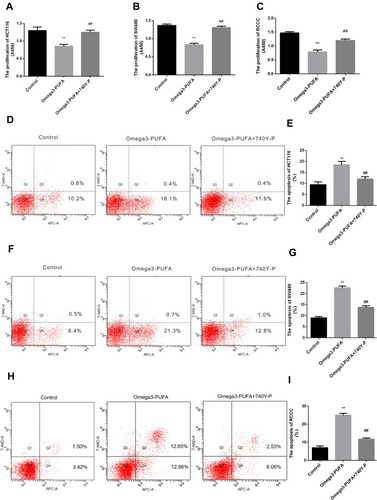
Figure 6 Omega-3PUFA regulates CRC cell proliferation and apoptosis by blocking PI3K-AKT-Bcl-2 signaling. (A, B, C) HCT116, SW480 or RCCC cells were pretreated with 10 μM PI3K activator (740Y-P) for 1h then exposed to Omega-3 PUFA. The proliferation of HCT-116 (A), SW480 (B) and RCCC (C) cells was detected by CCK8 assay. (D, F, H) Cells were pretreated with 10 μM PI3K activator (740Y-P) for 1h then exposed to Omega-3 PUFA. The cells were stained with Annexin V-APC and 7-AAD. The apoptosis of HCT-116 (D), SW480 (F) and RCCC (H) cells was detected by flow cytometry. Statistical analysis of relative expression levels of proteins. (E, G, I) Statistical analysis of apoptosis detection in HCT116 (E), SW480 (G) and RCCC (I) cells. Unpaired 2-tailed t test. **P < 0.01; ##P < 0.01. Bar graphs represent the mean ± SD for A, B, C, E, G and I.