Figures & data
Table 1 The Clinical Pathological Characteristics of NSCLC Patients
Figure 1 The expression level of circ_0000735 in NSCLC tissue and cells. (A) The abundance of circ_0000735 in NSCLC tissue and nearby normal tissue was detected by RT-qPCR assay. (B) RT-qPCR assay was used to show circ_0000735 expression in NSCLC tissue with different TNM stage. (C) Prognostic significance of circ_0000735 expression for NSCLC patients was conducted using the Kaplan–Meier method. (D) RT-qPCR assay was performed for examining circ_0000735 level in NSCLC cell lines and human bronchial epithelial cell line (16HBE). (E and F) The expression levels of circ_0000735 and mp2RX1 were estimated by RT-qPCR at the indicated time after treatment with actinomycin D. *P<0.05.
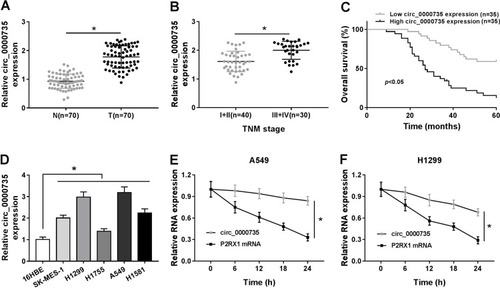
Figure 2 Influence of circ_0000735 silencing on proliferation, migration, invasion, and glycolysis of NSCLC cells. (A and B) The abundant of circ_0000735 in the cytoplasm and nuclear of A549 and H1299 cells was analyzed by RT-qPCR assay, GAPDH and U6 were used as positive controls, respectively. (C–K) A549 and H1299 cells were administrated with si-circ_0000735 or si-NC. (C) The interference efficiency of si-circ_0000735 was checked by RT-qPCR assay. (D and E) Effect of circ_0000735 silencing on proliferation of A549 and H1299 cells was measured with CCK-8 and colony-forming assays. (F and G) Transwell migration and invasion assays were implemented to examine the migration and invasion ability of A549 and H1299 cells. (H and I) Extracellular acidification rate (ECAR) of A549 and H1299 cells was shown. (J and K) Lactate production was detected in A549 and H1299 cells by indicated kit. *P<0.05.
Abbreviations: Glc, glucose; O, oligomycin; 2-DG, 2-deoxy-D-glucose.
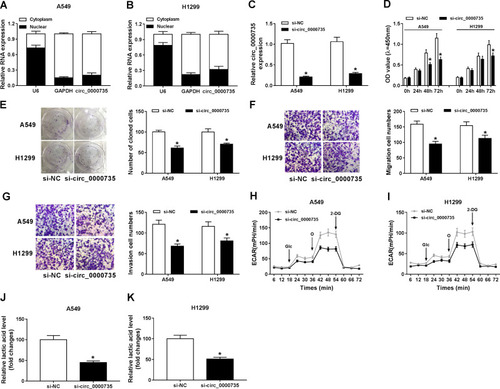
Figure 3 Influence of circ_0000735 overexpression on proliferation, migration, invasion, and glycolysis of NSCLC cells. (A–I) A549 and H1299 cells were transfected with vector or circ_0000735. (A) The overexpression efficiency of circ_0000735 was assessed by RT-qPCR assay. (B and C) The proliferation ability of A549 and H1299 cells was determined with CCK-8 and colony-forming assays. (D and E) the migration and invasion of A549 and H1299 cells were assessed by transwell assay. (F and G) The extracellular acidification rate curves of A549 and H1299 cells were plotted after overexpression of circ_0000735. (H and I) Lactate production was shown in A549 and H1299 cells. *P<0.05.
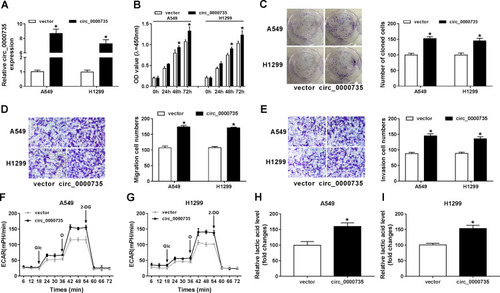
Figure 4 miR-940 was a direct target of circ_0000735. (A) Binding domain between miR-940 and circ_0000735, as well as matched mutated nucleotide sites were shown. (B and C) Dual-luciferase reporter assay was employed to detect the luciferase activity in A549 and H1299 cells co-transfected with WT-circ_0000735 or MUT-circ_0000735 and miR-940 mimic or miR-NC, respectively. (D and E) RT-qPCR assay was performed to evaluate the expression level of miR-940 in A549 and H1299 cells infected with si-circ_0000735, circ_0000735, si-NC, or vector. *P<0.05.
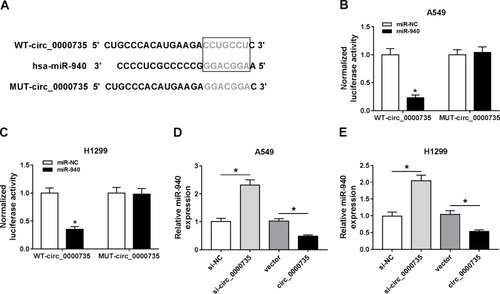
Figure 5 Overexpression of miR-940 impeded proliferation, migration, invasion, and glycolysis of NSCLC cells. (A and B) The expression level of miR-940 was tested with RT-qPCR in NSCLC tissue and adjacent normal tissue, as well as in 16HBE, A549, and H1299 cells. (C) RT-qPCR was performed to confirm the overexpression efficiency of miR-940 in A549 and H1299 cells. (D and E) CCK-8 and colony-forming assays were applied to evaluate cell viability of A549 and H1299 cells transfected with miR-940 or miR-NC. (F and G) The migration and invasion abilities of A549 and H1299 cells were estimated by transwell assay after transfection with miR-940 or miR-NC. (H) The extracellular acidification rate curves were plotted using glucose, oligomycin, and 2-deoxy-D-glucose at specific times. (I) Lactate production level was detected in A549 and H1299 cells after being transfected with miR-940 or miR-NC. *P<0.05.
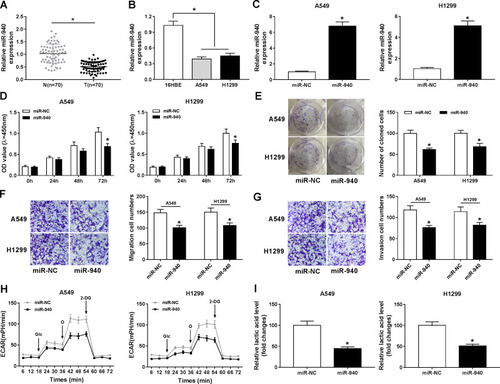
Figure 6 BMPER was negatively regulated by miR-940. (A) The predicted binding sites between miR-940 and mRNA 3ʹUTR of BMPER were displayed. (B and C) Dual-luciferase reporter assay was carried out to confirm the interaction between miR-940 and BMPER. (D and E) Transfection efficiency of anti-miR-940 was tested using RT-qPCR assay. (F and G) The Western blot assay was applied to measure BMPER protein level in A549 and H1299 cells introduced with anti-miR-940, anti-NC, miR-NC, or miR-940. (H and I) The protein expression level of BMPER was evaluated by Western blot assay in A549 and H1299 cells transfected with vector, circ_0000735, circ_0000735+miR-NC, circ_0000735+ miR-940. *P<0.05.
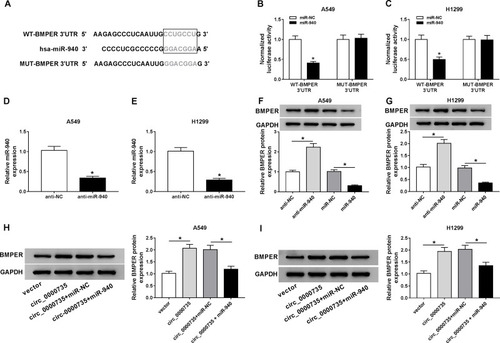
Figure 7 Upregulation of BMPER reversed si-circ_0000735-induced the effects on proliferation, migration, invasion, and glycolysis in NSCLC cells. (A) The protein expression level of BMPER was measured by Western blot assay in A549 and H1299 cells infected with vector or BMPER. (B–H) A549 and H1299 cells were infected with si-NC, si-circ_0000735, si-circ_0000735+vector, or si-circ_0000735+BMPER. (B) Western blot assay was performed for examining protein expression of BMPER in A549 and H1299 cells posttransfection. (C and D) The cell proliferation of A549 and H1299 cells was assessed by CCK-8 and colony-forming assays. (E and F) Cell migration and invasion capabilities were examined in transfected A549 and H1299 cells using transwell analysis. (G) Extracellular acid ratio of cells was measured in A549 and H1299 cells after transfection. (H) The lactate production of transfected A549 and H1299 cells were shown. *P<0.05.
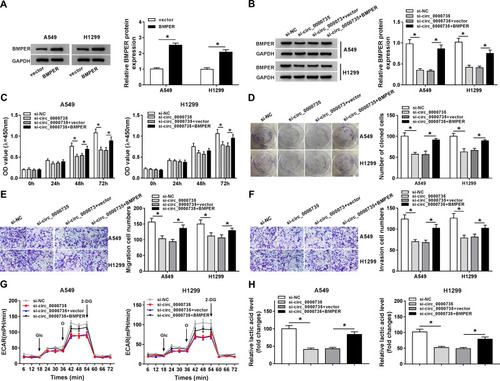
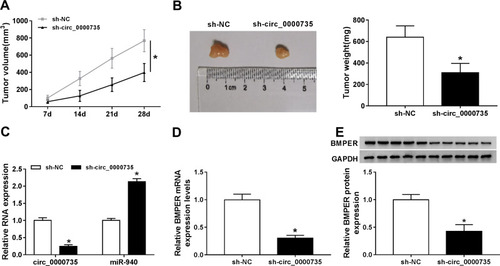
Figure 8 Silencing of circ_0000735 repressed tumor growth in vivo. (A) The growth curves of xenograft tumors were shown by measuring tumor size every seven days. (B) Tumor weight was calculated on the day when mice were euthanized. (C and D) The expression levels of circ_0000735, miR-940, and circ_0000735 in tumor tissue were detected by RT-qPCR assay. (E) Western blot assay was conducted for examining protein expression of BMPER in tumor tissue. *P<0.05.