Figures & data
Table 1 Primer Sequences
Figure 1 Identification of exosomes derived from LLC, A549, and Beas-2b cells. (A) Detection of exosomes by TEM (scale bar = 500 nm). Arrows indicate exosomes. (B) Protein expression of ALIX, TSG101, and CD63 was measured by Western blot.
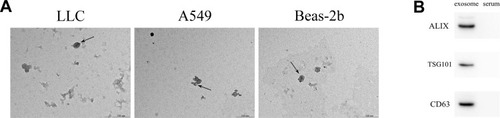
Figure 2 qRT-PCR measurement of MALAT1 expression. The results are presented as the mean ± SD, n = 3. *P < 0.05 vs Beas-2b.
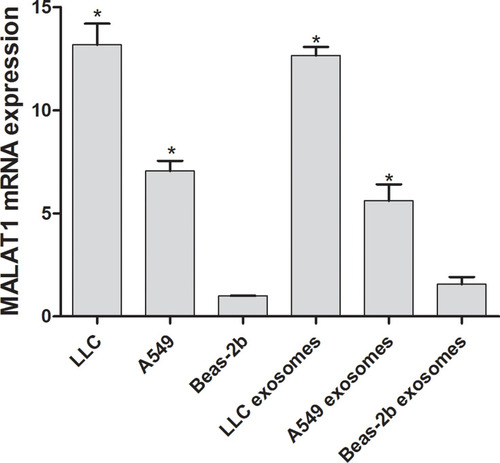
Figure 3 Controls for interference expression. (A) MALAT1 expression in Control, NC, and si-MALAT1 (1–4) groups. (B and C) Identification of exosomes in PEX, PEX-si, and PEXN groups by Western blot and TEM (scale bar = 500 nm). Arrows indicate exosomes. *P < 0.05 vs Control.
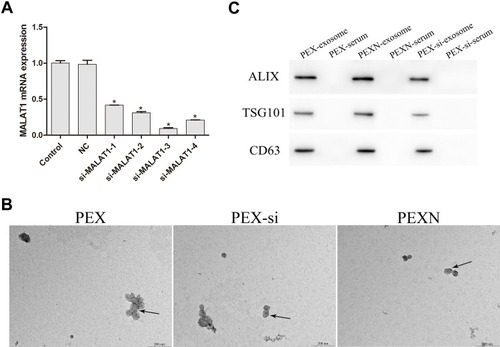
Figure 4 In vivo detection of tumor volume and proliferation. (A) Tumor volume was measured every two days and the inhibitory effect of siMALAT1 increased with time. (B) Tumor proliferation was observed by Ki-67 staining. The results are presented as the mean ± SD, n = 3. *P < 0.05 vs Control.
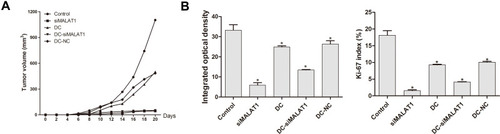
Figure 5 Identification of DCs and T cells. (A and B) The purity of DC and T cells was measured by flow cytometry.
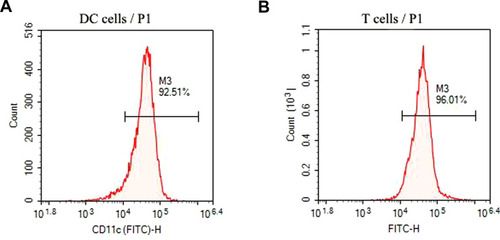
Figure 6 Effect of LLC-derived exosomes on DC phagocytosis, inflammatory response, and costimulatory molecule expression. (A and B) Cell phagocytosis and CD80 expression were observed by flow cytometry. (C) Levels of IFN-γ, IL-12, IL-10, and TGF-β were observed by ELISA. The results are presented as the mean ± SD, n = 3. *P < 0.05 vs Control.
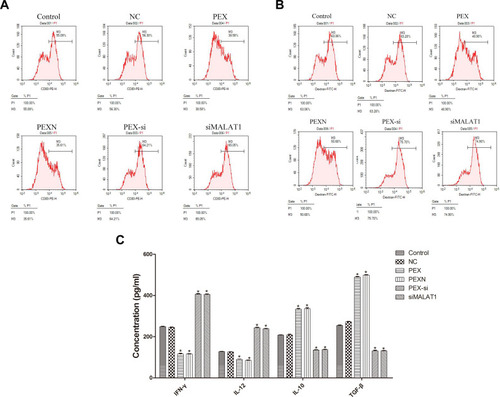
Figure 7 Effect of LLC-derived exosomes on DC autophagy. (A) Autophagic vacuoles were detected by TEM (scale bar = 2 μm). The black arrows represent autophagic vacuoles. (B) Autophagy-related proteins were examined by Western blot. The results are presented as the mean ± SD, n = 3. *P < 0.05 vs Control.
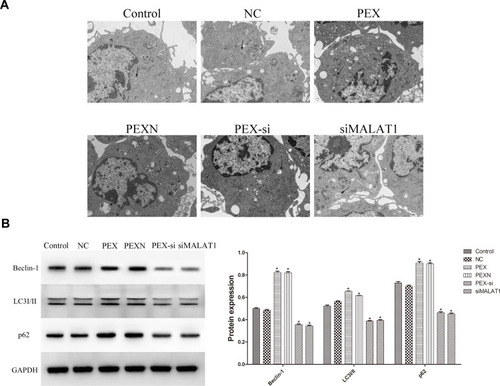
Figure 8 Effect of LLC-derived exosomes on T cell proliferation and differentiation. (A) Proliferation and (B) differentiation of T cells were detected by flow cytometry. The results are presented as the mean ± SD, n = 3. *P < 0.05 vs Control.
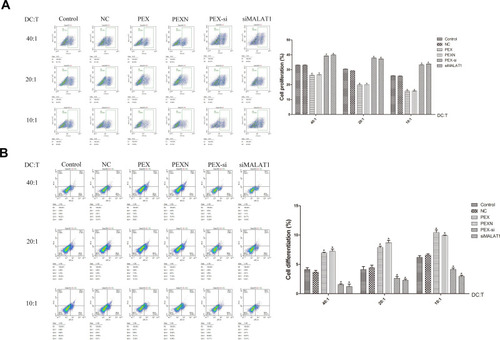
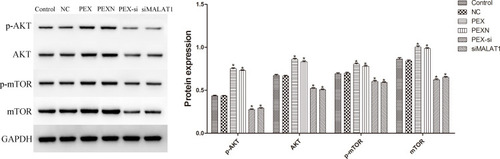
Figure 9 Effect of LLC-derived exosomes on AKT/mTOR pathway. The results are presented as the mean ± SD, n = 3. *P < 0.05 vs Control.