Figures & data
Figure 1 Apatinib inhibited proliferation and colony formation of colorectal cancer cells in vitro. (A) HCT116, SW620, SW480 and CT26 cells were treated with indicated concentrations of apatinib. Cell viability was tested by MTT assay after 24, 48 and 72 h. (B) Colorectal cancer cells were pretreated with indicated doses of apatinib for 24 h and then cells were seeded at a density of 500 cells per well into a 6-well plate. After cultured for 14 days, the clones were fixed and stained with crystal violet. The data were expressed as mean ± SEM obtained from triplicate experiments. *P < 0.05, **P < 0.01 vs control group.
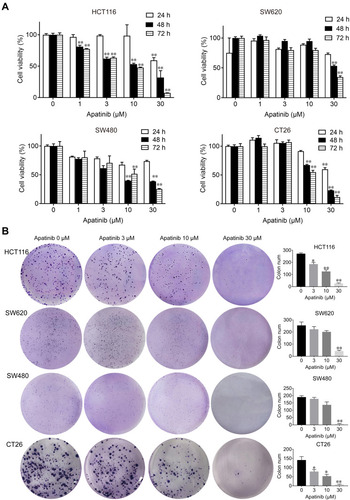
Figure 2 Apatinib induced apoptosis of colorectal cancer cells. CT26 cells (A) and HCT116 cells (B) were treated with indicated doses of apatinib or control (vehicle: 0.1% DMSO) for 24 h. Cells were then analyzed by Annexin V/PI staining. Data shown are representative of three experiments. CT26 cells (C) and HCT116 cells (D) were treated with indicated doses of apatinib for 24h. PARP expression was detected by immunoblotting, and β-Actin was used as a loading control. Results represent three repeated experiments. (E) HCT116 cells were treated with indicated doses of apatinib alone or in combination with Z-VAD-FMK (20 μM) for 24 h. Cell viability was tested by MTT assay. Data are expressed as means ± SEM of three experiments. **P < 0.01 vs control group.
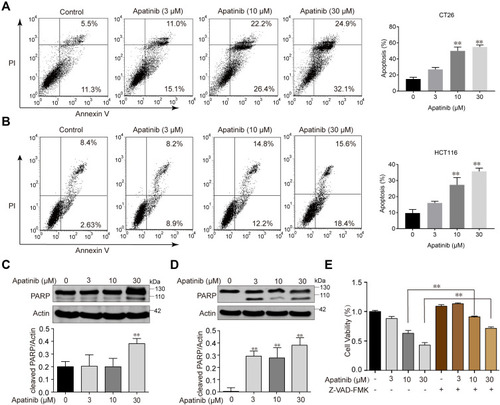
Figure 3 Apatinib arrested cell cycle progression and inhibited the invasion and migration of colorectal cancer cells. (A) CT26 cells and HCT116 cells were treated with indicated doses of apatinib for 24 h, after which the cells were washed, fixed, stained with PI, and analyzed for DNA content by flow cytometry. (B) HCT116 cells and CT26 cells were pretreated with apatinib at the different concentrations for 24 h. After 24 h, trans-well assay invasion was performed as described in the methods. (C) HCT116 cells were pretreated with apatinib at the different concentrations for 24 h. After 24 h, the wound healing assay was performed as described in the methods. Data are expressed as means ± SEM of three experiments. *P < 0.05, **P < 0.01 vs control group.
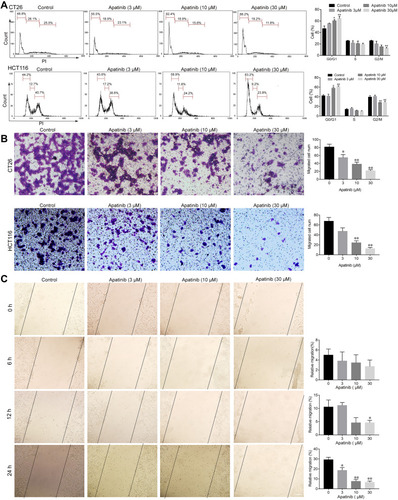
Figure 4 Apatinib inhibited the β-catenin pathway. Apatinib decreased mRNA and protein levels of endogenous β-catenin target genes in HCT116 and CT26 cells. HCT116 cells were treated with 30 μM apatinib for 24 h, and different expression genes were analyzed by RNA-seq. mRNA levels of β-catenin target genes were analyzed (A) and further confirmed by RT-PCR (B). Data shown represent the mean of three independent RT-PCR reactions, graphed as relative expression level compared to that of DMSO-treated control. (C and D) The effects of apatinib on β-catenin target gene products in HCT116 (C) and CT26 cells (D) were examined through Western blot analyses. The level of β-actin was used as a loading control. Data are expressed as means ± SEM of three experiments. *P < 0.05, **P < 0.01 vs control group.
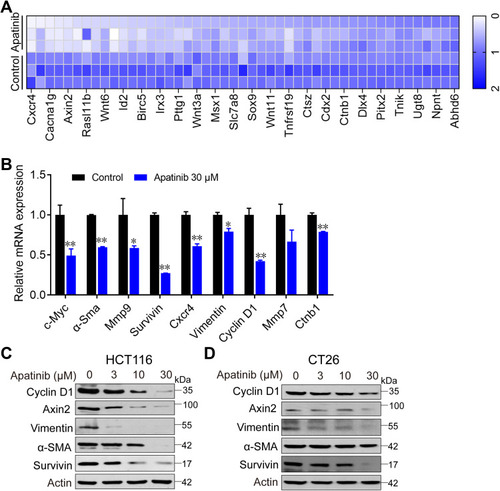
Figure 5 Apatinib increased the ubiquitination of β-catenin and inhibited the nuclear translocation of β-catenin. (A) HCT116 and CT26 cells were treated with apatinib for 24h; the expression of related proteins was detected by immunoblotting. The level of β-Actin was used as a loading control. (B) Apatinib increased the ubiquitination of β-catenin. β-catenin was immunoprecipitated using the anti-β-catenin antibody in HCT116 and CT26 cells, immunoprecipitated fractions were analyzed by Western blot analysis to examine the protein level of Ub (ubiquitin). (C) HCT116 and CT26 cells were treated with 3, 10, 30 µM Apatinib for 24 h. The nucleus/cytoplasmic fractionation was separated and the localization of beta-catenin was corroborated by Western blot. (D) Apatinib inhibited nuclear translocation of β-catenin. HCT116 cells were treated with 30 µM Apatinib for 24 h. The image shows β-catenin (red)-stained Fluor-conjugated secondary antibody and the nucleus (blue) stained with DAPI, and the merged image of apatinib-treated cells shows the cytoplasm location of the β-catenin protein. Scale bar 10 μm. (E) HCT116 cells were incubated with or without apatinib (30 μM) for 2 h, and then the cells were collected and subjected to CETSA assay. (F) HCT116 cells with or without VEGFR2 knockdown were treated with apatinib for 24 h, and then cells were seeded at a density of 500 cells per well into a 6-well plate. After cultured for 14 days, the clones were fixed and stained with crystal violet. The data were expressed as mean ± SEM obtained from triplicate experiments. *P < 0.05 vs control group.
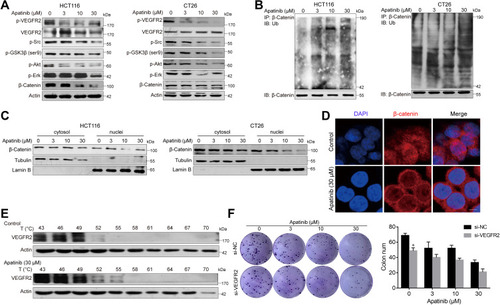
Figure 6 Apatinib inhibited the growth of colorectal cancer cells in vivo. 2 × 10⁶ CT26 cells were transplanted subcutaneously into the armpit of the BALB/c mice. Three days after transplanted, mice were randomly allocated to either control or treatment groups, with 6 mice per group. Drugs were intraperitoneal injected (see in Materials and methods). Bodyweight and tumor volumes were measured every two days (A and D). After mice were sacrificed, solid tumors were separated and weighted (B and C). Data are expressed as means ± SEM, n=8. *P < 0.05, **P < 0.01 vs control group.
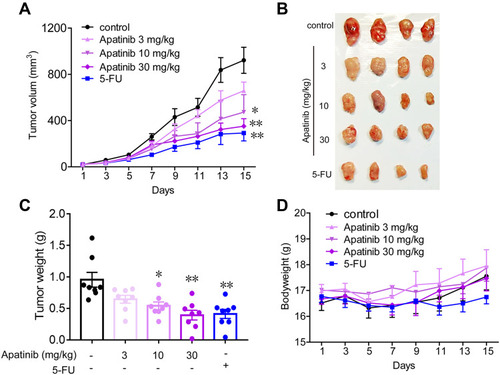
Figure 7 Apatinib promoted tumor cell apoptosis and inhibited the proliferation of tumor cells in vivo. (A) The tumor tissues of the mice were fixed and sliced. The morphology and density of the tumor cells of each group were observed by H&E staining. (B and D) Immunohistochemistry staining and quantitative analysis of PCNA in tumor tissues. (C and E) TUNEL staining and quantitative analysis of apoptotic tumor cells in each group. Scale bar 100 μm, *p<0.05, **p<0.01 vs control group.
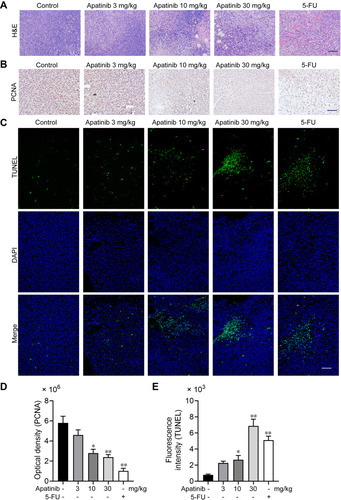
Figure 8 Apatinib inhibited the VEGFR2-β-catenin pathway in vivo. (A) The expression of β-catenin and p-VEGFR2 in tumor tissues was detected by immunoblotting. (B) The Immunohistochemistry staining and quantitative analysis of p-VEGFR2, β-catenin. (C) The Immunohistochemistry staining and quantitative analysis of cyclin D1, p-Erk and CD31 in tumor tissues of each group. *P < 0.05, **P < 0.01 versus control group.
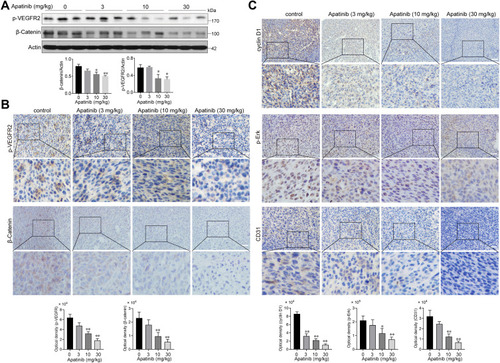
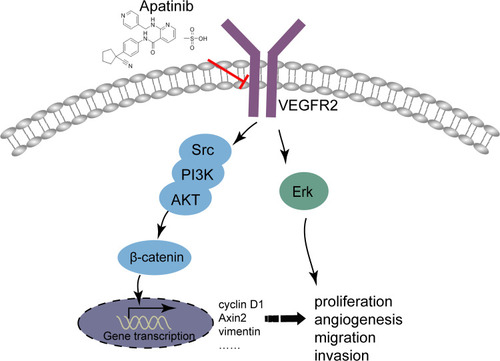
Figure 9 Illustration for the mechanism underlying apatinib induced colorectal cancer growth inhibition. By inhibiting VEGFR2-β-catenin mediated singling for colorectal cancer proliferation, invasion, migration and VEGFR2-mediated angiogenesis, apatinib successfully suppressed colorectal cancer growth, suggesting the utility of apatinib as an effective therapeutic strategy for colorectal cancer in the clinic.