Figures & data
Table 1 Clinicopathological Characteristic of OS Patients from TARGET Database
Table 2 The PCR Primers Utilized in This Study
Figure 1 Schematic diagram of the methods.
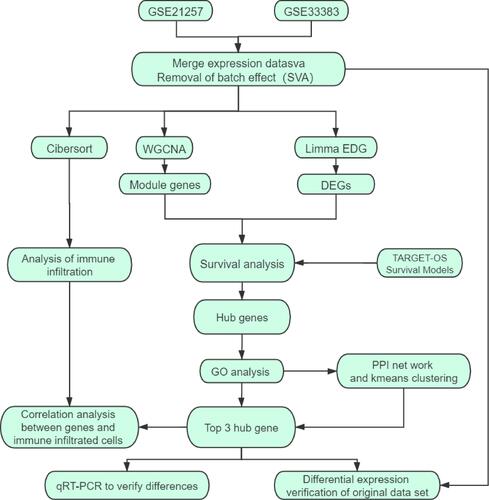
Figure 2 Data consolidation and removal of batch effects. (A) The data before removal of batch effects. (B) The data after removal of batch effects and normalization. The sample is exhibited on the X-axis and the relative expression is exhibited on the Y-axis.
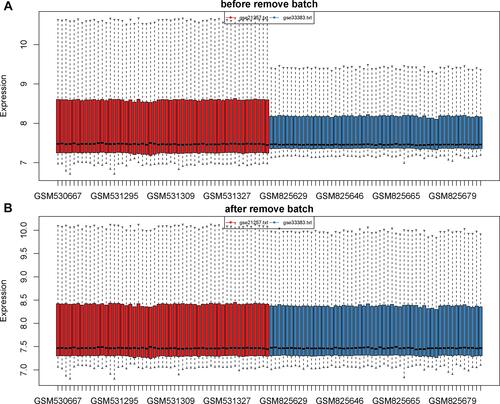
Figure 3 Construction and identification of the clinical characteristics-related modules. (A) The clustering dendrogram combined 106 cases of OS samples. (B) The clustering dendrogram of samples setting a height red line of 80 and the clinical trait heatmap. White represents the low value and red represents the high value in the traits of age and grade. While white represents non-metastasis or female and red represents metastasis or male in the traits of metastasis and gender. (C) The network topologic analysis of different soft thresholds (power). The chart on the left shows the effect of soft threshold power (X-axis) on the scale-free fit index (Y-axis). The chart on the right exhibits the effect of the soft threshold power (X-axis) on the average connectivity (degree, Y-axis). (D) Gene dendrogram and modules partition. Each colour represents a module. (E) The number of genes was measured in different gene co-expression modules. (F) Heatmap analysis for the correlation between clinical features and module eigengenes. Each row and column indicate the module’s characteristic gene and clinical trait, respectively; the corresponding coefficient of correlation and p-value are listed in each cell. According to the colour legend, the table is color-coded through correlation.
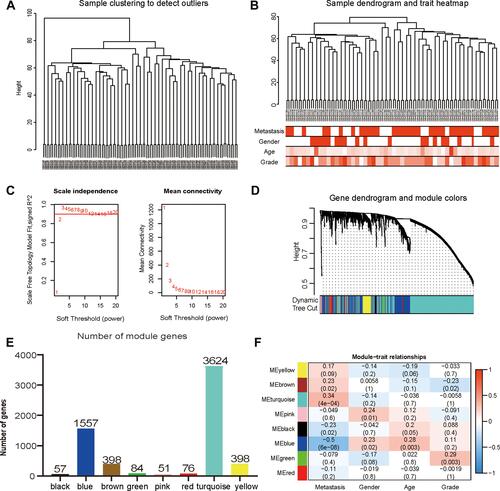
Figure 4 Screening of candidate genes. (A) The scatter chart of GS relative to MM in the blue module. (B) The volcano plot of DEGs of metastatic OS and non-metastatic OS with a threshold p-value < 0.05 and |log2(fold-change)| > 1. (C) The intersection of 114 genes with a highly significant correlation in the module and 44 downregulated genes in DEGs. (D) Survival analysis of candidate genes obtained from intersections. Note that only 12 genes are significantly associated with the overall survival of patients with OS (p < 0.05). The blue line means a low expression group, the yellow line means a high expression group. Representative gene names and P-values are listed in the lower-left corner of each figure.
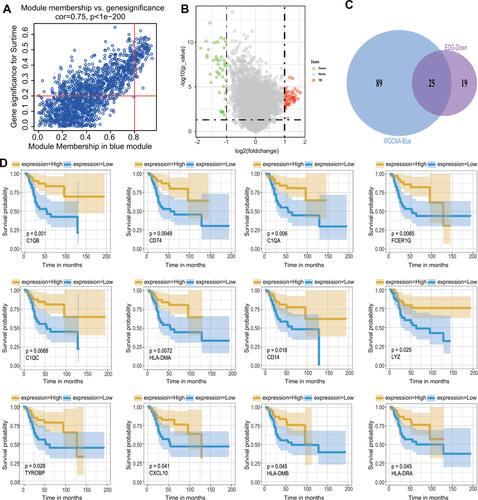
Figure 5 Hub gene screening. (A) The GO analysis of candidate genes. (B) Networks of interactions between 6 genes and K-means clustering. The solid line represents the stronger interaction between the 2 proteins and was clustered into one group, the dashed line represents the not-clustered group. (C) The expression level of 3 genes, C1QA, C1QB, and C1QC, in the combined dataset of 106 samples; blue represents the non-metastatic OS and red represents the metastatic OS. **p < 0.01, ****p < 0.0001.
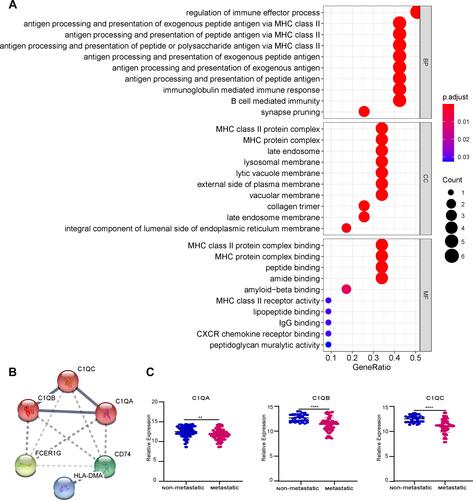
Figure 6 Analysis of immune infiltration. (A) 22 immune cell components were evaluated in the combined OS dataset (n = 106) using CIBERSORT. The X-axis and Y-axis indicate the sample and percentage, respectively; the colour represents the type of immune cell. (B) The varied proportions of 22 kinds of immune cells in non-metastatic and metastatic OS samples. Red represents the metastatic OS samples and blue represents the non-metastatic OS samples.
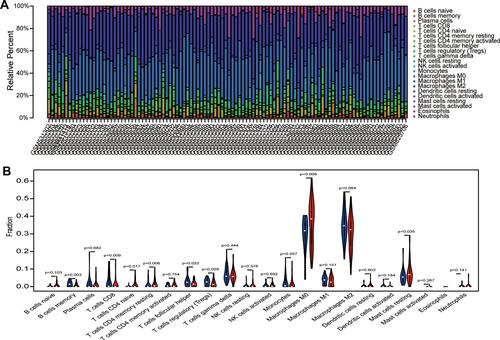
Figure 7 The correlation between expression of C1QA, C1QB, and C1QC and proportion of immune cells. Linear regression relationship of the 3 immune cells, memory B cells, CD8 T cells and follicular helper T cells with C1QA (A), C1QB (B), and C1QC (C).
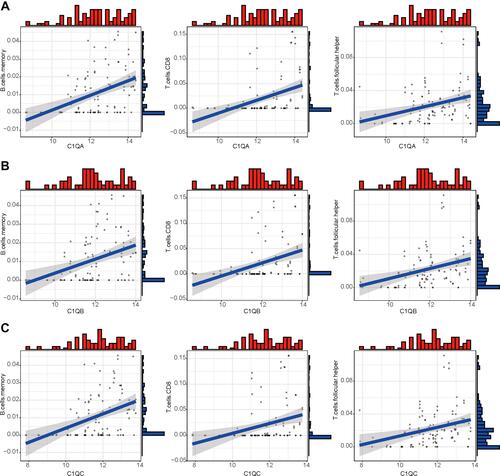
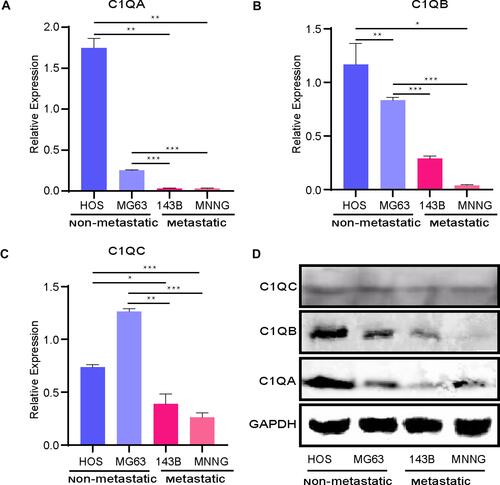
Figure 8 Relative mRNA expression of the key genes C1QA (A), C1QB (B), and C1QC (C) was determined in metastatic and non-metastatic OS cell lines by quantitative RT-PCR analysis. *p < 0.05, **p < 0.01, ***p < 0.001. (D) C1QA, C1QB, and C1QC protein expressions were detected in metastatic and non-metastatic OS cell lines by Western blot analysis. GAPDH was the loading control.