Figures & data
Figure 1 Urolithin A inhibits EMT in lung cancer cells. (A) A549 and H460 cells were exposed to 10 μM urolithin A for 24 h. Cell morphology was assessed by phase-contrast microscopy (magnification 100×), scale bars 200 μm. (B) Wound Healing Assay reveals a dose-dependent (urolithin A 0, 10, 20 μM) (upper panel) and time-dependent (0, 12, 24 h) (lower panel) decrease in cell migration, scale bars represent 200 μm. The quantification was present in right panel. (*P < 0.05, **P < 0.01, ***P < 0.001 for difference from untreated control by ANOVA with Dunnett’s correction for multiple comparisons). (C) A549 and H460 were exposed to different concentrations of urolithin A (0, 10, 20 μM) treatment for 24 h. The cell invasiveness was assessed by Transwell chamber, scale bars indicate 200 μm. (**P < 0.01, ***P < 0.001 for difference from untreated control by ANOVA with Dunnett’s correction for multiple comparisons). (D) A549 and H460 cells were treated with different concentrations of urolithin A (0, 5, 10, 15, 20, 25 μM). Western blot examined epithelial marker E-cadherin, mesenchymal markers N-cadherin, Vimentin.
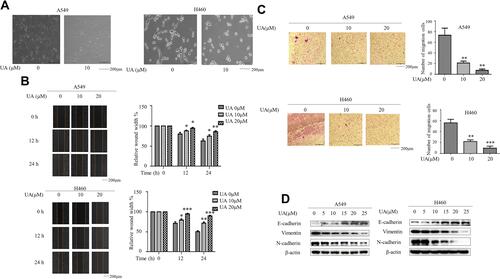
Figure 2 Snail is required for inhibition of EMT by urolithin A in lung cancer cells. (A) Western blot demonstrates decreased Snail expression following 5 h of urolithin A (0, 5, 10, 15, 20 and 25 μM) stimulation in H1299 and A549 cell lines compared with Slug, Twist and Zeb1. (B) The cells transfected with a control or Snail-specific siRNA. At 48 h post-transfection, cells were stimulated with urolithin A for additional 10 h. Western blotting shows that the expression of E-cadherin was increased in cells transfected with a Snail siRNA. (C) A549 and H460 cells were transfected with a Snail cDNA. After 48 h, cells were untreated or treated with the indicated amounts of urolithin A for 10 h. Western blotting shows that the urolithin A-induced levels of E-Cadherin decreased further in the cells transfected with a Snail cDNA. (D) The cell migration of A549 and H460 after transfection of Snail cDNAs and urolithin A treatment (urolithin A 0, 10 μM) was assessed by the Wound healing assay. The quantification was present in right panels. (*P<0.01, **P<0.01, ***P<0.001 for the difference from the control cells). (E) The cell invasion and motility of A549 and H460 after transfection of Snail cDNAs and urolithin A treatment were assessed by the Cell Invasion Assay. (**P<0.01, ***P<0.001 for the difference from the control cells).
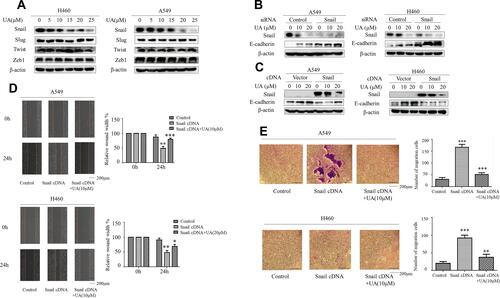
Figure 3 Urolithin A induces Snail degradation via mdm2-mediated ubiquitination. (A) A549 and H460 cells were treated with urolithin A (0, 10 and 20 μM) for 5 h. The expression of Snail gene was detected by RT-PCR. (ns means no statistical difference). (B) A549 and H460 cells were co-transfected with a plasmid of the Snail promoter luciferase reporter gene with a plasmid of control Renilla luciferase reporter gene. At 36 h after transfection, cells were treated with urolithin A (0, 5, 10 and 20 μM) for 5 h, and luciferase activity was detected using the dual luciferase reporter system. (ns means no statistical difference). (C) Cells were treated with CHX (Cycloheximide, 50 μg/mL) for the indicated time in the presence or absence of urolithin A. Western blot was used to determine Snail protein levels. (D) Western blotting analysis of Snail, p62 and LC3A/B after cells were pre-treated with 20 μM HCQ for 1 h and then treated with urolithin A (0, 10 and 20 μM) for 5 h in A549 and H460 cells. (E) Western blotting analysis of Snail, after cells were pre-treated with 20 μM PII for 1 h and then treated with urolithin A (0, 10 and 20 μM) for 5 h in A549 and H460 cells. (F) Cells were treated with urolithin A after which cell lysates were immunoprecipitated with anti-Snail antibody and then Western blotted with anti-Ubiquitin. (G) Western blot examined mdm2 expression flowing 5 h of urolithin A (0, 5, 10, 15, 20 and 25 μM) stimulation in A549 and H460 cells. (H and I) After transfection with mdm2 cDNA (H) or mdm2 siRNA (I) for 48 h, A549 and H460 cells were treated with urolithin A (0, 10 and 20 μM) for 5 h. Western blot was carried out for analysis of Snail levels. (J) Cells were treated with urolithin A for 5 h after which cell lysates were immunoprecipitated with anti-mdm2 antibody and then Western blotted with anti-Snail.
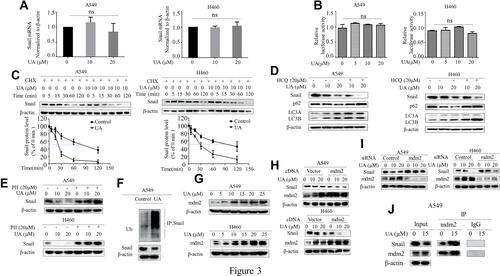
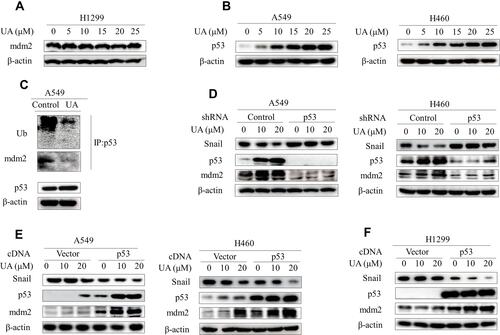
Figure 4 Urolithin A upregulates mdm2 by inhibiting the interaction of p53 and mdm2. (A) H1299 cells were treated with different concentrations of urolithin A (0, 5, 10, 15, 20 and 25 μM) for 5 h. Western blot examined the expression of mdm2. (B) Western blot demonstrates expression of p53 following 5 h of urolithin A (0, 5, 10, 15, 20 and 25 μM) stimulation in indicated lung cancer cell lines. (C) Cells were treated with urolithin A for 5 h after which cell lysates were immunoprecipitated with anti-p53 antibody and then Western blotted with anti-Ubiquitin and anti-mdm2 antibodies. (D) Transfection of A549 and H460 cells with p53 shRNA for 48h, and then treated with different concentrations of urolithin A for 5 h, the expression levels of mdm2 and Snail were analyzed by immunoblotting. (E and F) Indicated cells were transfected with p53 cDNA. After 48 h, cells were treated with urolithin A (0, 10 and 20 μM) for 5 h. The levels of mdm2 and Snail were detected by Western blotting.