Figures & data
Table 1 Clinicopathological Characteristics of the Whole Series
Figure 1 Heat map and volcano plot of differentially expressed microRNAs.
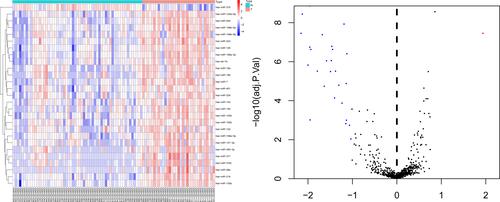
Table 2 KEGG Enrichment Analysis of Potential Target mRNAs
Figure 2 Screening of potential TFs and target mRNAs of differentially expressed microRNAs. (A) Identification of the potential TFs of differentially expressed microRNAs by FunRich software. (B) The top 10 of biological process, cellular component, and molecular function of the target genes of microRNAs.
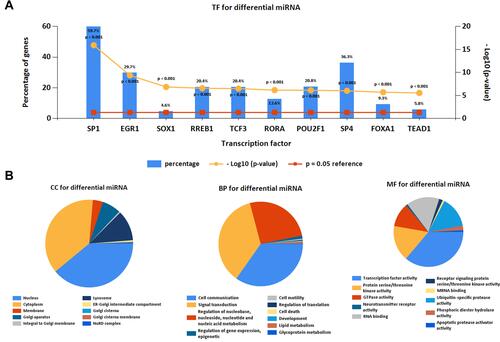
Figure 3 KEGG pathway enriched by potential target mRNAs.
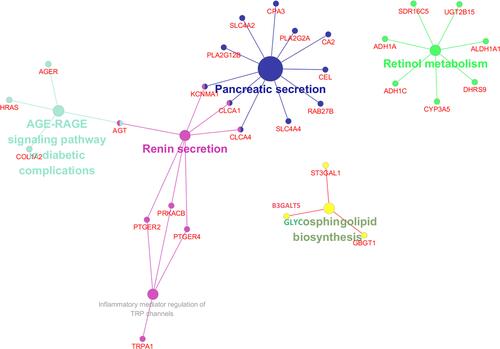
Figure 4 Identified target mRNAs and microRNA-mRNA regulatory network. (A) Venn Diagram of GSE41655 and GSE57965. (B) microRNA-mRNA regulatory network.
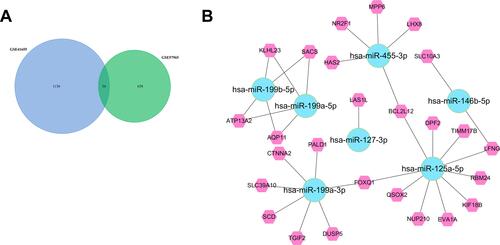
Figure 5 The association between microRNAs and colorectal cancer prognosis.
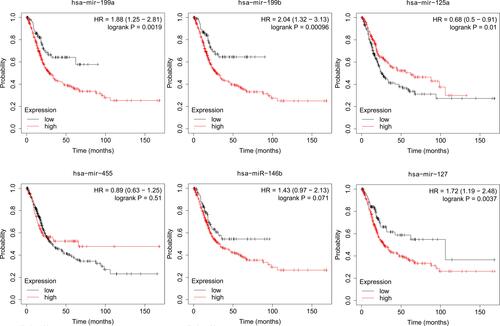
Figure 6 Identification of the signature significantly associated with the survival of patients with CRC in the training group. (A) LASSO Cox regression algorithm was used to reduce the scope. (B) Time-dependent ROC curves analysis. (C and D) Risk score distribution and survival status for patients in high- and low-risk groups by the signature. LASSO, least absolute shrinkage and selection operator; ROC, receiver operating characteristic.
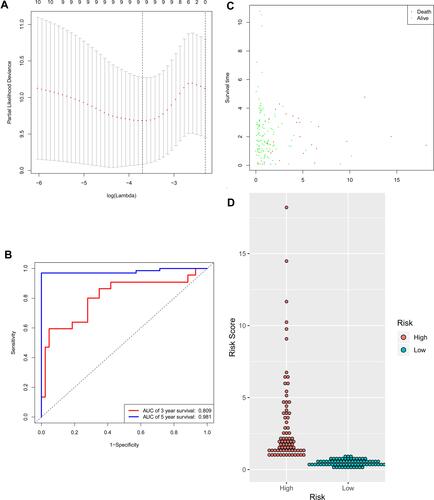
Table 3 Expression of BCL2L12 Protein in Colorectal Adenoma and Carcinoma
Figure 7 Genes expression in human colorectal carcinoma specimens and adenomas. (A) Venn Diagram of GSE41655 and TCGA. (B) QRT-PCR results indicate that the expression levels of microRNA-455 and microRNA-125a in tissues of adenoma patients and cancer patients. (C) BCL2L12 expression in adenoma patients and colorectal carcinoma patients.
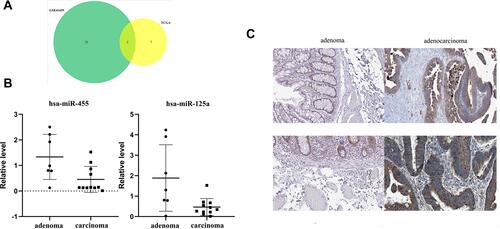
Table 4 Results of Connectivity Map Analysis
Figure 8 Chemical structure diagram of navitoclax.