Figures & data
Table 1 Association of miR-362-3p with the Clinicopathological Characteristics of NPC Patients
Figure 1 Expression of miR-362-3p in NPC patients. (A) The levels of miR-362-3p in 497 tumor tissue samples and 44 normal tissue samples from TCGA HNSC cohort. (B) Expression of miR-362-3p in the serum of NPC patients and healthy controls from our study cohort. (C) Expression of miR-362-3p in NPC tissues and normal tissues of NPC patients. (D) There was a significant positive correlation between serum miR-362-3p levels and miR-362-3p levels in NPC tissues (r = 0.823, P < 0.001). (E) ROC curve indicated the high diagnostic value of miR-362-3p for screening NPC patients from healthy controls. ***P < 0.001 vs HNSC tissue samples from TCGA HNSC cohort or Healthy controls from our study cohort or Normal tissues.
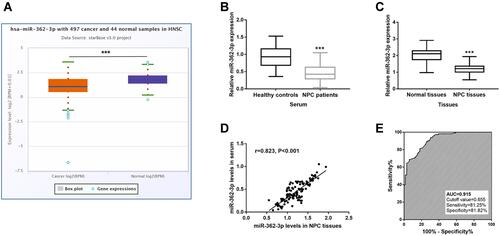
Table 2 Cox Regression Analysis Results for Patients with NPC
Figure 2 Relationship of miR-362-3p expression with NPC patient survival. (A) Expression levels of miR-362-3p in NPC tissues from non-survivors and survivors in patients. (B) Low miR-362-3p expression was associated with short survival of NPC patients (log-rank P = 0.026). ***P < 0.001 vs Survivors.
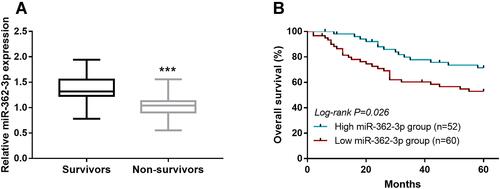
Figure 3 Different miR-362-3p expression in NPC between EBV negative and positive cases. (A) Expression of miR-362-3p in EBV+ patients and EBV- patients. (B) Expression of miR-362-3p in normal cell line (NP69), EBV+ (C666-1) and EBV- (SUNE1) NPC cell lines. (C) ROC analysis indicated the ability of miR-362-3p to discriminate between EBV infection positive and negative patients. ***P < 0.001 vs EBV- patients or NP69 cells. ##P < 0.01 vs SUNE1 cells.
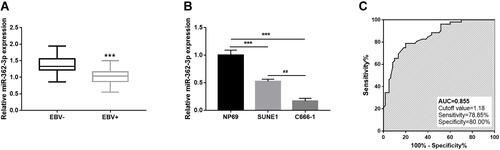
Figure 4 Effects of miR-362-3p on NPC cell proliferation, migration and invasion. (A and B) In SUNE1 and C666-1 cells, miR-362-3p mimic promoted, and miR-362-3p inhibitor suppressed the levels of miR-362-3p. (C and D) In SUNE1 and C666-1 cells, miR-362-3p overexpression inhibited, and miR-362-3p knockdown promoted cell proliferation. (E and F) miR-362-3p overexpression inhibited, and miR-362-3p knockdown promoted the migration and invasion of SUNE1 and C666-1 cells. *P < 0.05, **P < 0.01 ***P < 0.001 vs Control.
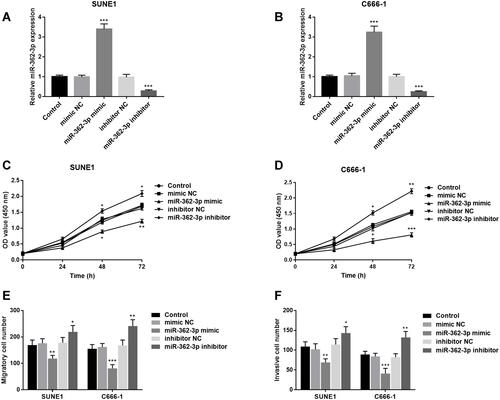
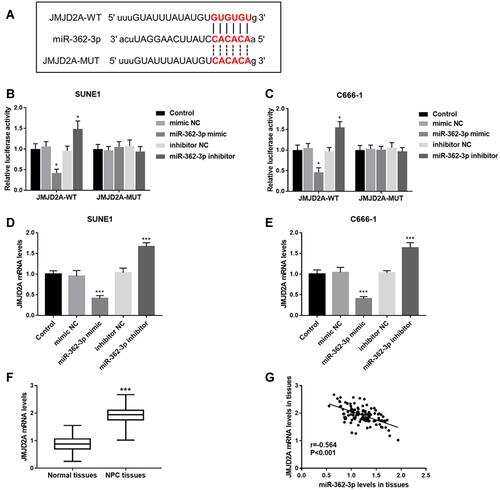
Figure 5 miR-362-3p directly inhibited JMJD2A in NPC. (A) Complementary binding sequences between miR-362-3p and JMJD2A. (B and C) Relative luciferase activity in the JMJD2A-WT group was inhibited by miR-362-3p overexpression and facilitated by miR-362-3p knockdown. However, there was no change in luciferase activity in the JMJD2A-MUT group. (D and E) JMJD2A mRNA levels were inhibited by miR-362-3p overexpression and promoted by miR-362-3p knockdown in both SUNE1 and C666-1 cell lines. (F) The mRNA levels of JMJD2A in NPC tissues and normal tissues of patients. (G) There was a significant negative correlation between JMJD2A mRNA levels in tissues and miR-362-3p levels in tissues (r = −0.564, P < 0.001). *P < 0.05 vs Control; ***P < 0.001 vs Control or Normal tissues.