
Figures & data
Figure 1 Study flow.
Abbreviations: EGFR, epithelial growth factor receptor; GPP, gefitinib plus pemetrexed/platinum.
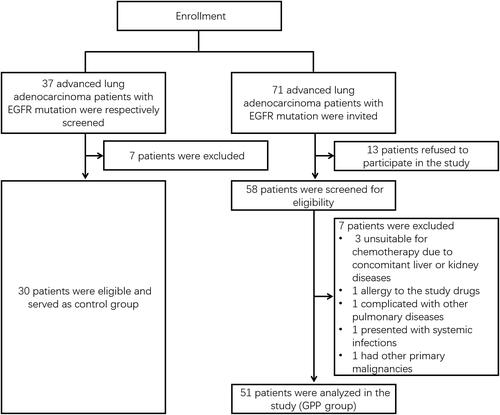
Table 1 Clinical Characteristics of Patients with EGFR-Mutated Advanced Lung Adenocarcinoma
Figure 2 Cumulative PFS and OS. Comparison of cumulative PFS rate (A) and OS rate (B) between GPP group and control group.
Abbreviations: PFS, progression-free survival; OS, overall survival; CI, confidence interval; EGFR, epithelial growth factor receptor; GPP, gefitinib plus pemetrexed/platinum.
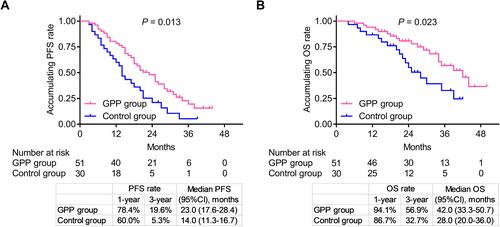
Figure 3 Related factors for PFS. Univariate and multiple Cox proportional hazard regression were conducted to explore risk factors for PFS with P value and crude HR (95% CI).
Abbreviations: ECOG, Eastern Cooperative Oncology Group; PS, performance status; EGFR, epithelial growth factor receptor; TNM, tumor node metastasis; HR, hazard ratio; CI, confidence interval; PFS, progression-free survival; GPP, gefitinib plus pemetrexed/platinum.
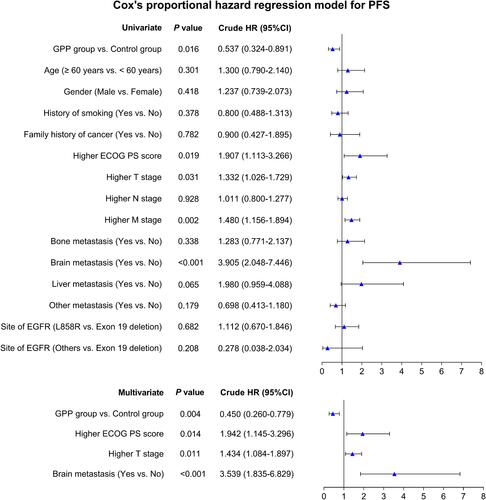
Figure 4 Related factors for OS. Univariate and multiple Cox proportional hazard regression were conducted to explore risk factors for OS with P value and crude HR (95% CI).
Abbreviations: ECOG, Eastern Cooperative Oncology Group; PS, performance status; EGFR, epithelial growth factor receptor; TNM, tumor node metastasis; HR, hazard ratio; CI, confidence interval; OS, overall survival; GPP, gefitinib plus pemetrexed/platinum.
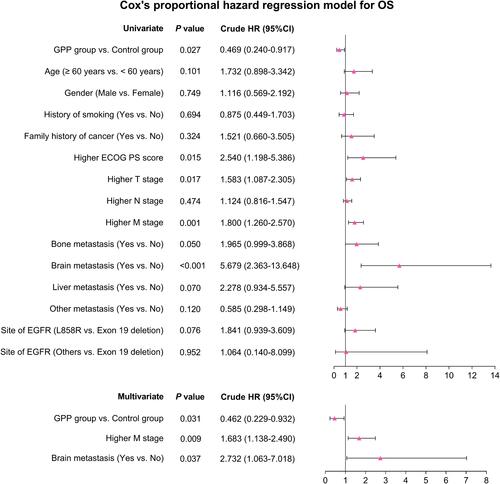
Table 2 Adverse Events in GPP Group