Figures & data
Table 1 Baseline Clinical Characteristics of the Study Population in the Discovery Set and Validation Set
Figure 1 The workflow in this study.
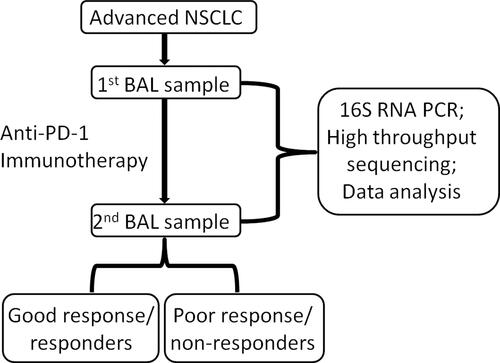
Figure 2 Quantification of bacterial 16S rRNA gene copies in BAL before and after anti-PD-1 treatment. The y axis indicates the 16S rRNA gene copy number by quantitative PCR. Each sample was analyzed in triplicate. Statistics was performed using Mann–Whitney test.
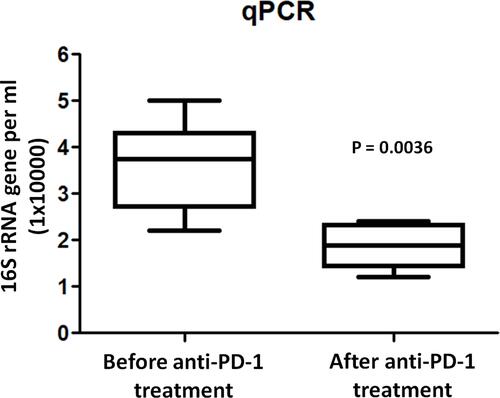
Figure 3 Microbiota composition at the phylum level. Relative abundances of the 7 dominant bacterial phyla found across all 92 samples (two samples per patient: B, before treatment; F, after treatment) are shown as Bar chart. Samples are grouped by patients with different sampling time points.
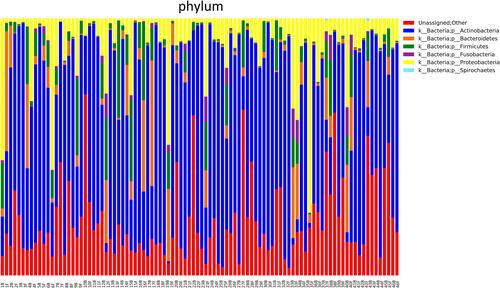
Figure 4 PCA plots were used to show similarities of all microbiota samples based on patient using weighted UniFrac analysis based on species presence and absence also takes relative abundances of microbiota members into account. Using UniFrac distance matrices, samples are plotted in three-dimensional space so that the principal coordinates PC1 through PC3 show as much of the total variation among the samples as possible (in percent). Samples ID are unique color-coded.
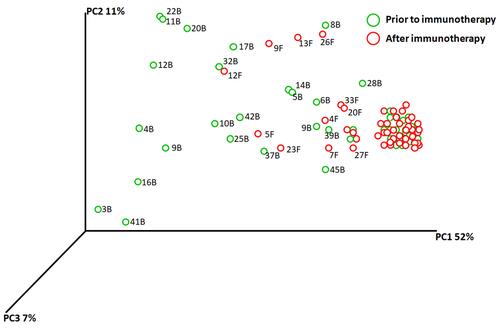
Figure 5 Hierarchical clustering of immunotherapy response based on genus level microbiota compositions. Dendrograms show sample similarities based on similar patterns in relative abundance of microbiota members based on Euclidean distance calculations. Rows are also clustered hierarchically based on similar relative abundances across samples. The color of each entry is determined by the value of that fold difference, ranging from green (lower abundance) to red (higher abundance).
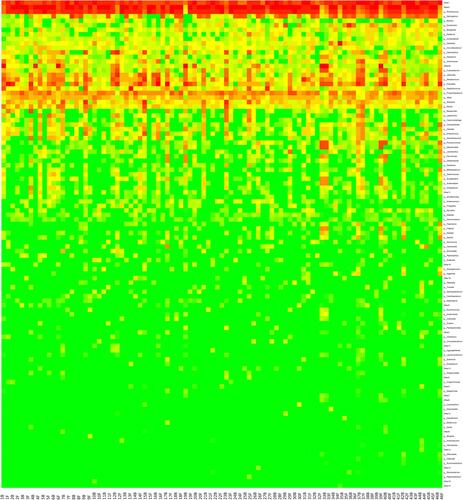
Figure 6 Fusobacterium at each genera level were quantified before and after anti-PD-1 treatment in the responder patients. Multivariate analysis was tested on each bacterium at phylum, class, order, family, genus levels among responders.
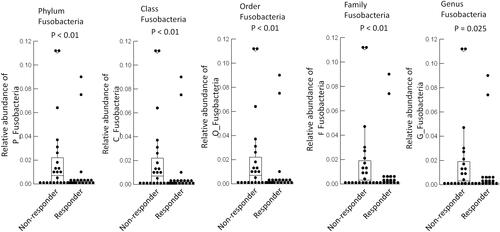
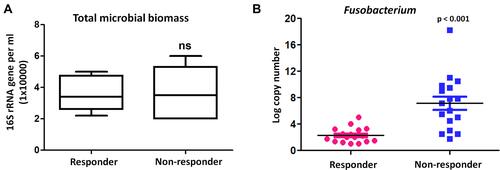
Figure 7 Fusobacterium was associated with poor response to anti-PD-1 therapy. (A) BAL bacterial load (burden) analysis between responders and non-responders in an independent cohort of 17 responder patients compared with 17 non-responder patients. The y axis indicates the 16S rRNA gene copy number by quantitative PCR. Each sample was analyzed in triplicate. Statistics was performed using Mann–Whitney test. ns represent p > 0.05. (B) Bacterial levels of Fusobacterium were measured by quantitative PCR of its 16S ribosomal RNA gene between responders and non-responders before anti-PD-1 treatment.