Figures & data
Table 1 Baseline patient characteristics of adenoid cystic carcinoma patients
Table 2 Correlation analysis for associations between expression of FRα and clinicopathological features
Figure 1 (A) Negative, (B) low positive, (C) moderately positive and (D) high positive staining of FRα in ACC.
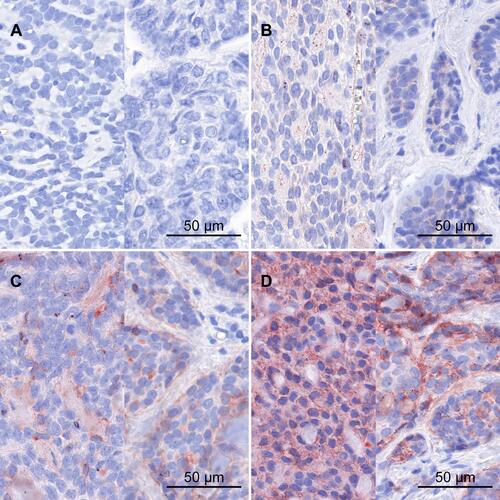
Table 3 Univariable and multivariable analysis of cause-specific survival (CSS) and disease-free survival (DFS) and FRα expression
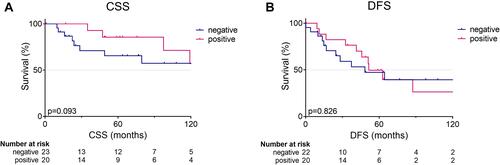
Figure 2 Kaplan–Meier survival curves for (A) cause-specific survival (CSS) and (B) disease-free survival (DFS) and FRα protein expression. Survival was analyzed using log-rank test. p, log-rank p value.