Figures & data
Table 1 The Expression Level of TROP2 in Breast Tissues
Figure 1 IHC staining of TROP2 in BC tissues on tissue microarray sections. Positive staining was observed as dark brown color. (A and E) Low expression of TROP2 in BC tissues and matched adjacent tissues, respectively. (C and G) High expression of TROP2 in BC tissues and matched adjacent tissues, respectively. (A), (C), (E) and (G) were scanned by Vectra Polaris Pathology Imaging System at ×10 magnification (bar, 500 μm), (B), (D), (F) and (H) were shown at original × 50 magnification (bar, 100 μm).
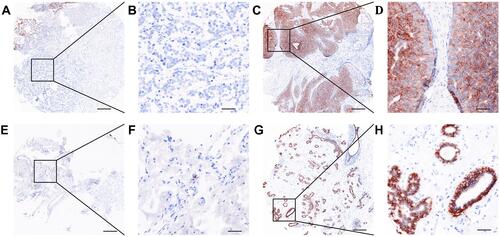
Table 2 Correlation Between the TROP2 Expression Levels and Clinicopathologic Features in BC Patients
Figure 2 Survival analysis based on TROP2 expression in BC tissues by Kaplan–Meier method and Log rank test. (A) Survival analysis in 241 BC patients collected from Shanghai General Hospital, China. (B) Survival analysis in 181 BC patients from Tang_2018 and Liu_2014 online protein databases (Kaplan–Meier Plotter).
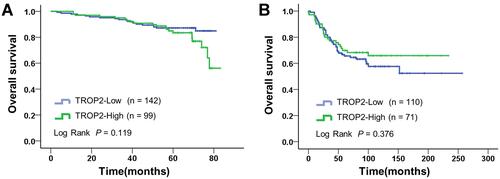
Table 3 Summary of the TROP2 Relative Expression Levels, IC50 and Imax Values of Diverse BC Cell Lines
Figure 3 The expression levels of TROP2 were significantly correlated with the anti-tumor effects of DS001 in diverse BC cell lines. Dose-response curves generated after 96 h treatment with (A) MMAE and (B) DS001. Data were represented as mean ± SD (n = 3). Correlation between the TROP2 expression levels and IC50 values for (C) MMAE and (D) DS001. Correlation between the TROP2 expression levels and the Imax (%) values for (E) MMAE and (F) DS001. Pearson correlation coefficients were shown.
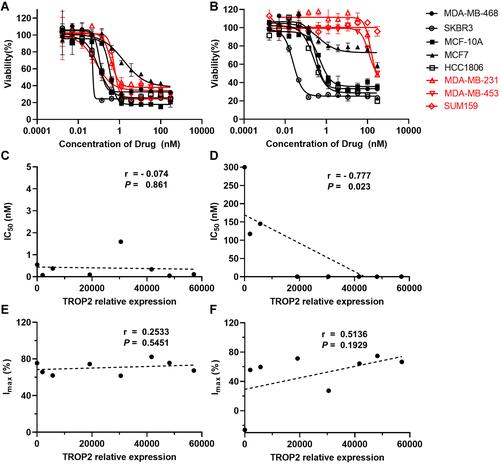
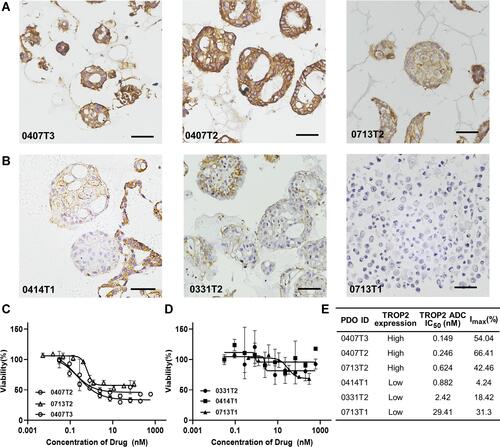
Figure 4 The expression levels of TROP2 were correlated with the anti-tumor effects of DS001 in PDOs. (A and B) IHC images of BC PDOs with high and low expression levels of TROP2, respectively. Images were captured by an Olympus optical microscope at 400× magnification (bar, 50 μm). (C and D) Dose-response curves of DS001 in PDOs with high and low TROP2 expression levels, respectively. (E) Calculated IC50 and Imax values by nonlinear regression (four-parameter).