Figures & data
Table 1 Next-Generation Sequencing Results
Figure 1 Treatment timeline.
Abbreviations: CR, complete response; PR, partial response; *Means chemotherapy cycles.
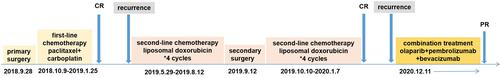
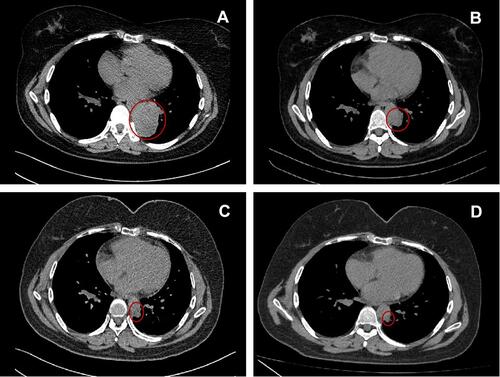
Figure 2 Radiological imaging of the patient before and after the combination treatment of olaparib, pembrolizumab, and bevacizumab. (A) Computed tomography (CT) performed on December 4, 2020, showing recurrence before treatment (baseline). (B and C) CT performed on March 17, 2021 (B) and May 31, 2021, (C) showing the reduced tumor size after four and eight cycles of combination therapy, respectively. (D) CT performed on December 2, 2021, identified little residue of the tumor. The red circle indicates the tumor.