Figures & data
Figure 1 Patient’s tumor response to corresponding chemo and hormonal therapy. (A) Hematoxylin and eosin stain of the primary tumor and right inguinal metastasis. (B) Patient’s CA-125 level as a function of time. Mar. 2016 when the patient received cytoreductive surgery, was marked as zero time point. The duration of chemo and hormonal therapies this patient received were indicated as colored boxes at the top of the graph. (C) The CT/MRI images of hepatic hilar metastasis (top) and right inguinal metastasis (bottom) pointed by the red arrows at each time point, along with evaluated tumor response to therapy were shown. The time of next generation sequencing of tumor samples was indicated by a green arrow.
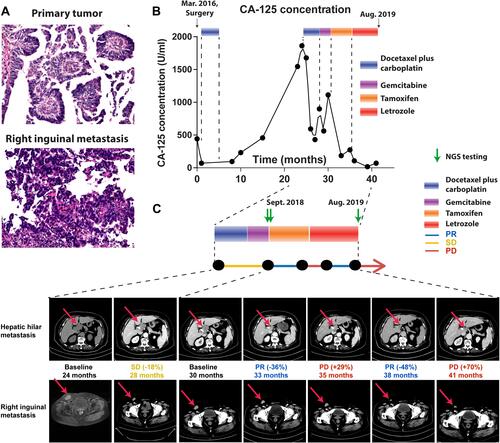
Table 1 Systemic Therapy Received by the Patient
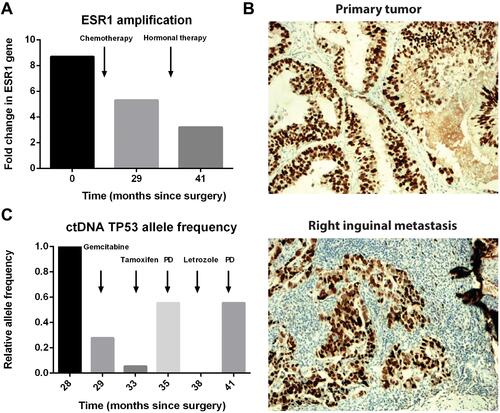
Figure 2 Amplification and overexpression of ESR1 in tumor samples from hepatic hilum and right groin. (A) The amplification of the ESR1 gene in tumor tissue samples at the indicated time. A decrease of ESR1 amplification in tumor tissue was observed after chemotherapy and hormonal therapy. Primary tumor and two right inguinal metastasis samples for next-generation sequencing were collected on Feb. 2016, Aug. 2018 and Aug. 2019 respectively. (B) Immunohistochemical staining of ESR1 in samples from the primary tumor (Mar. 2016) and right inguinal metastasis (Aug. 2018). (C) Change of allele frequency of TP53 in ctDNA of the patient. Patient’s ctDNA was sequenced at indicated time points, which were calculated as months since surgery on Mar. 2016. The allele frequency of TP53 gene was normalized to the sample at 27 months and compared with each other. PD represents the progressive disease.