Figures & data
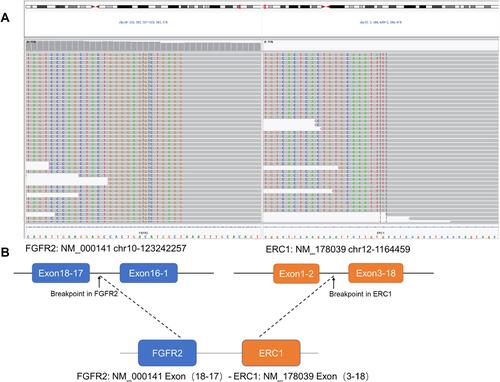
Figure 1 CT shows (A) the puncture position. (B–D) new lung cavities and metastases before treatment with anlotinib. (E–H) stabilization of lung lesions after anlotinib treatment. The red arrows in the figure indicate changes in lesions before and after treatment.
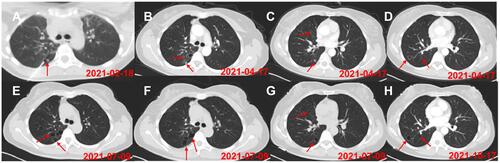
Figure 2 Pathological analysis of percutaneous lung biopsy. (A) HE staining confirmed typical lung adenocarcinoma morphology, immunohistochemistry showed that (B) Ki-67 was approximately 5% positive, (C) P40 negative, and (D) TTF-1 focally positive.
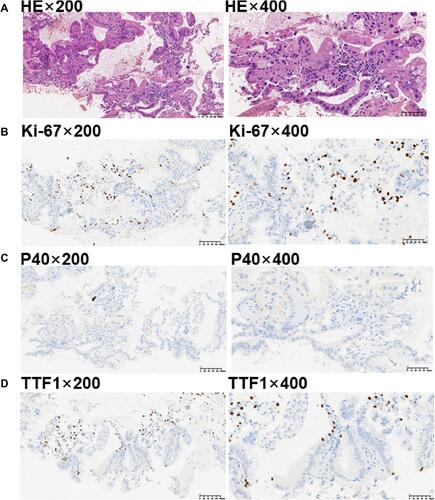
Figure 3 Next-generation sequencing analysis showed an FGFR2-ERC1 fusion mutation following blood analysis and lung tissue biopsy. (A) Integrative Genomics Viewer snapshot of the FGFR2-ERC1 fusion; (B) a schematic map of the FGFR2-ERC1 fusion protein domain structure.